7 Stones and Bones: Studying the Fossil Record
Sarah S. King, Ph.D., Cerro Coso Community College
Kara Jones, M.A., Ph.D. student, University of Nevada Las Vegas
This chapter is a revision from “Chapter 7: Understanding the Fossil Context” by Sarah King and Lee Anne Zajicek. In Explorations: An Open Invitation to Biological Anthropology, first edition, edited by Beth Shook, Katie Nelson, Kelsie Aguilera, and Lara Braff, which is licensed under CC BY-NC 4.0.
Learning Objectives
- Identify the different types of fossils and describe how they are formed.
- Discuss relative and chronometric dating methods, the type of material they analyze, and their applications.
- Describe the methods used to reconstruct past environments.
- Interpret a site using the methods described in this chapter.
Fossil Study: An Evolving Process
Mary Anning and the Age of Wonder
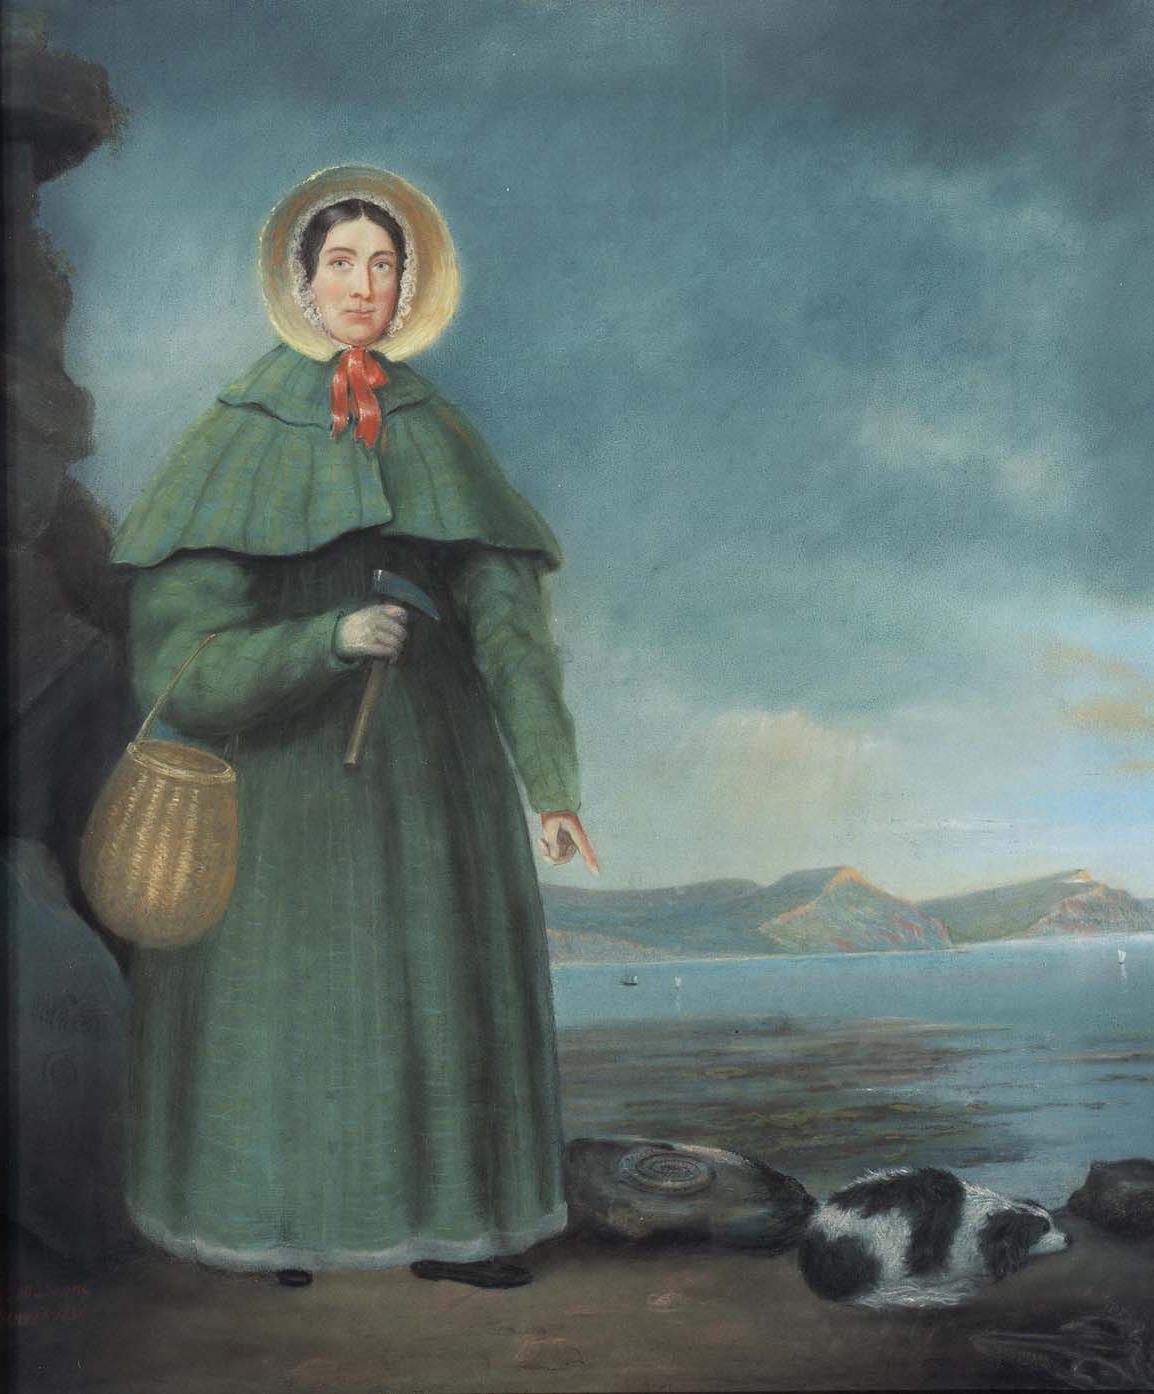
Mary Anning (1799–1847) is likely the most famous fossil hunter you’ve never heard of (Figure 7.1). Anning lived her entire life in Lyme Regis on the Dorset coast in England. As a woman, born to a poor family, with minimal education (even by 19th-century standards), the odds were against Anning becoming a scientist (Emling 2009, xii). It was remarkable that Anning was eventually able to influence the great scientists of the day with her fossil discoveries and her subsequent hypotheses regarding evolution.
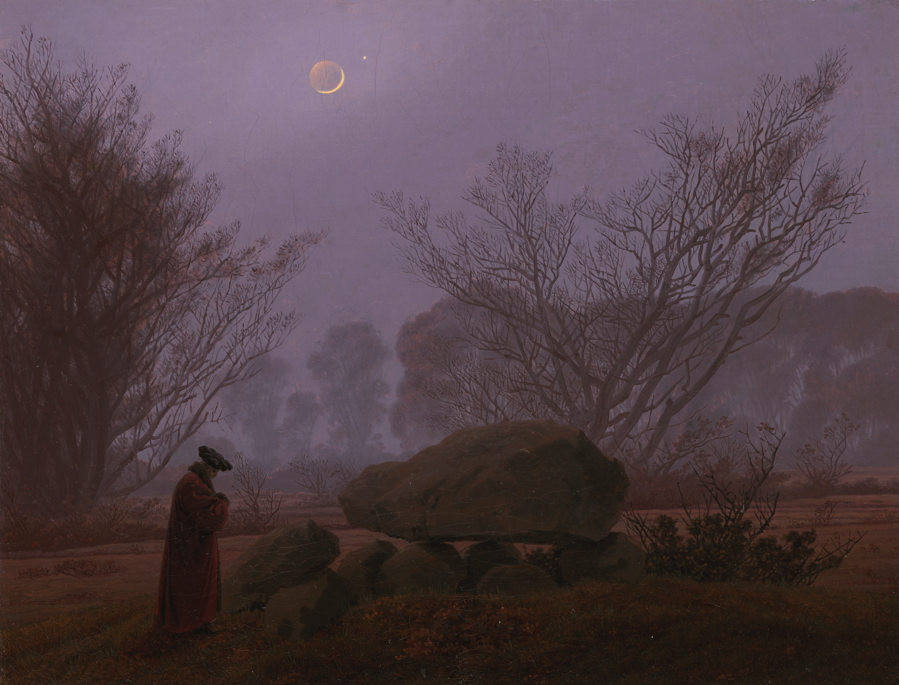
The time when Anning lived was a remarkable period in human history because of the Industrial Revolution in Britain. Moreover, the scientific discoveries of the 18th and 19th centuries set the stage for great leaps of knowledge and understanding about humans and the natural world. Barely a century earlier, Sir Isaac Newton had developed his theories on physics and become the president of the Royal Society of London (Dolnick 2011, 5). In this framework, the pursuit of intellectual and scientific discovery became a popular avocation for many individuals, the vast majority of whom were wealthy men (Figure 7.2).
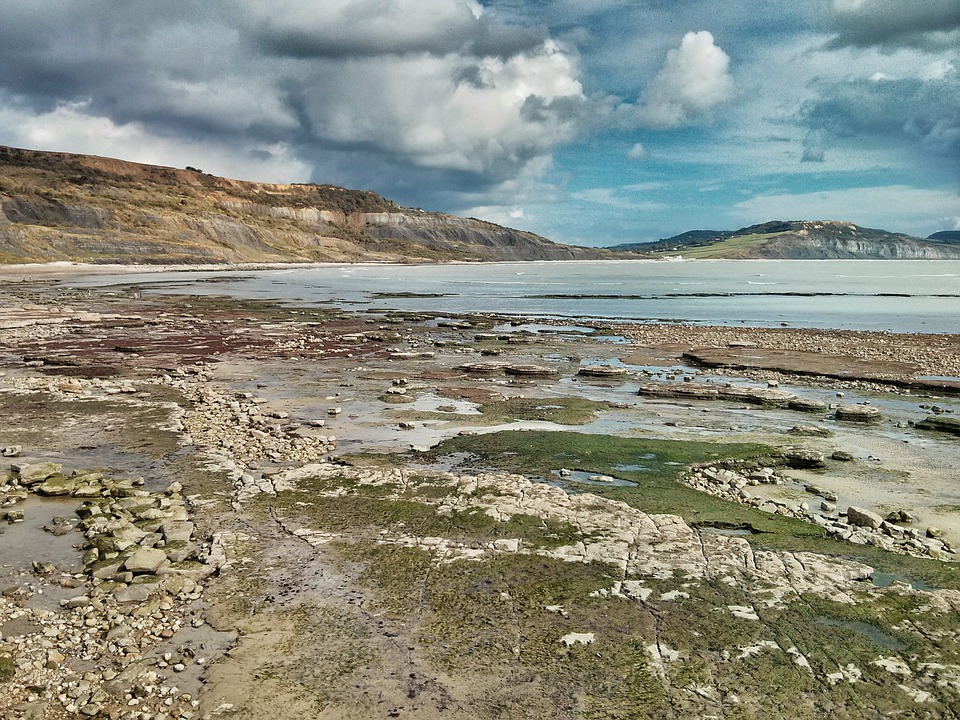
In spite of the expectations of Georgian English society to the contrary, Anning became a highly successful fossil hunter as well as a self-educated geologist and anatomist. The geology of Lyme Regis, with its limestone cliffs, provided a fortuitous backdrop for Anning’s lifework. Now called the “Jurassic Coast,” Lyme Regis has always been a rich source for fossilized remains (Figure 7.3). Continuing her father’s passion for fossil hunting, Anning scoured the crumbling cliffs after storms for fossilized remains and shells. The work was physically demanding and downright dangerous. In 1833, while searching for fossils, Anning lost her beloved dog in a landslide and nearly lost her own life in the process (Emling 2009).
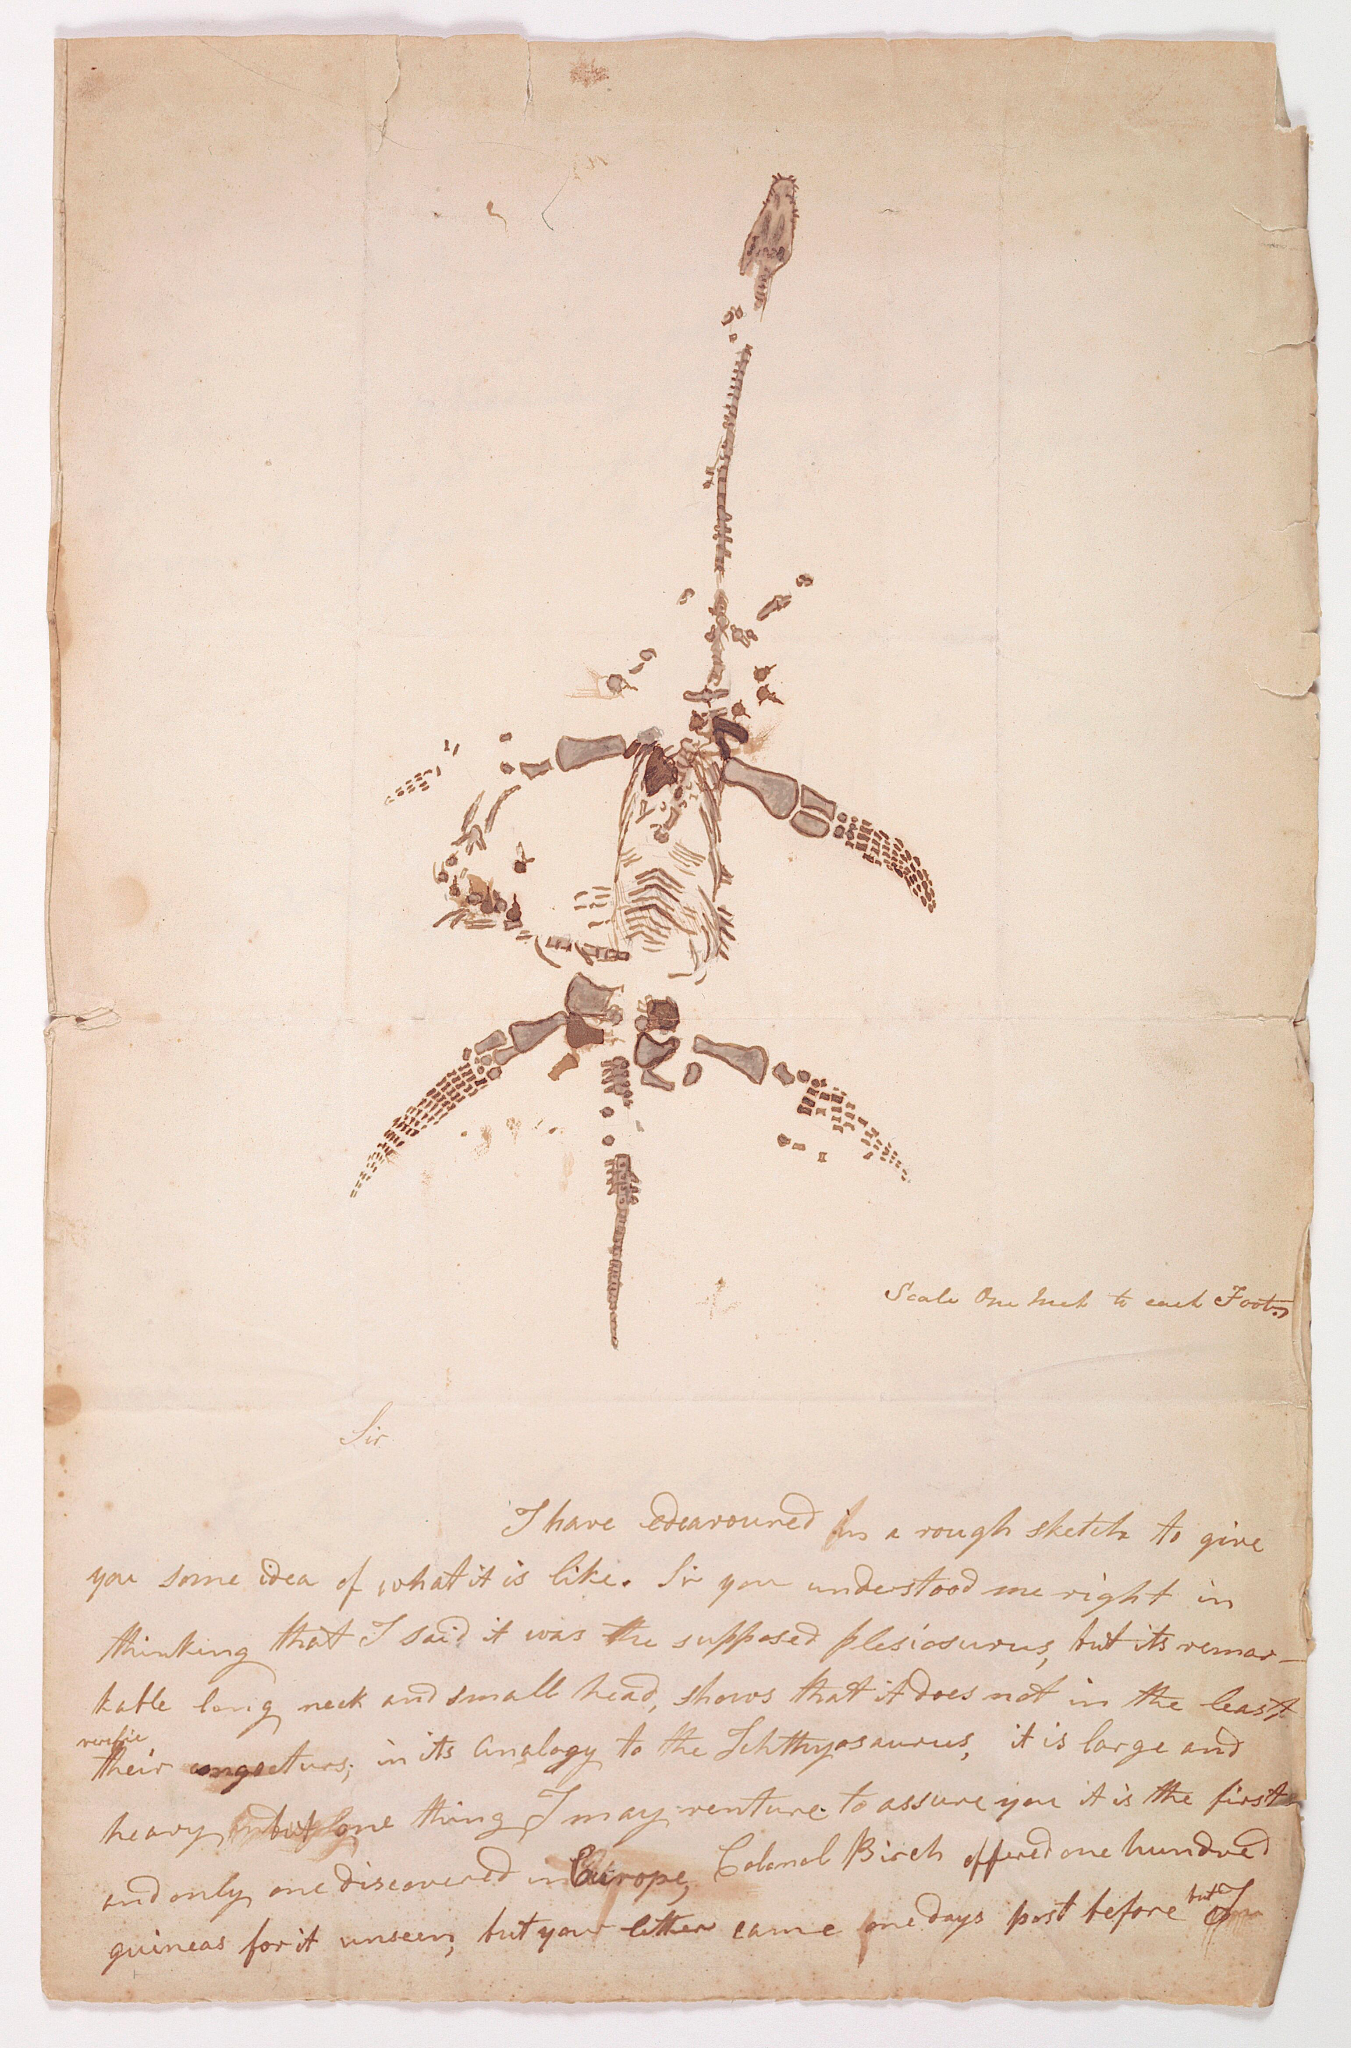
Around the age of ten, Anning located and excavated a complete fossilized skeleton of an ichthyosaurus (“fish lizard”). She eventually found Pterodactylus macronyx and a 2.7-meter Plesiosaurus, considered by many to be her greatest discovery (Figure 7.4). These discoveries proved that there had been significant changes in the way living things appeared throughout the history of the world. Like many of her peers, including Darwin, Anning had strong religious convictions. However, the evidence that was being found in the fossil record was contradictory to the Genesis story in the Bible. In The Fossil Hunter: Dinosaurs, Evolution, and the Woman Whose Discoveries Changed the World, Anning’s biographer Shelley Emling (2009, 38) notes, “the puzzling attributes of Mary’s fossil [ichthyosaurus] struck a blow at this belief and eventually helped pave the way for a real understanding of life before the age of humans.”
Intellectual and scientific debate now had physical evidence to support the theory of evolution, which would eventually result in Darwin’s seminal work, On the Origin of Species (1859). Anning’s discoveries and theories were appreciated and advocated by her friends, intellectual men who were associated with the Geological Society of London. Regrettably, this organization was closed to women, and Anning received little official recognition for her contributions to the fields of natural history and paleontology. It is clear that Anning’s knowledge, diligence, and uncanny luck in finding magnificent specimens of fossils earned her unshakeable credibility and made her a peer to many antiquarians (Emling 2009).
Fossil hunting is still providing evidence and a narrative of the story of Earth. Mary Anning recognized the value of fossils in understanding natural history and relentlessly championed her theories to the brightest minds of her day. Anning’s ability to creatively think “outside the box”—skillfully assimilating knowledge from multiple academic fields—was her gift to our present understanding of the fossil record. Given how profoundly Anning has shaped how we, in the modern day, think about the origins of life, it is surprising that her contributions have been so marginalized. Anning’s name should be on the tip of everyone’s tongue. Fortunately, at least in one sense of the word, it is. The well-known tongue twister, below, may have been written about Mary Anning:
She sells sea-shells on the sea-shore.
The shells she sells are sea-shells, I’m sure.
For if she sells sea-shells on the sea-shore
Then I’m sure she sells sea-shore shells.
—T. Sullivan (1908)
Developing Modern Methods
As Mary Anning’s story suggests, scientists in Europe were working at a time dominated by western Christian tradition. Literal interpretations of the bible did not allow for the long, slow processes of geological or evolutionary change to operate. However, many scientists were making observations that did not fit the biblical narrative. During the 18th century, Scotsman James Hutton’s work on the formation of Earth provided a much longer timeline of events than previous biblical interpretations would allow. Hutton’s theory of Deep Time was crucial to the understanding of fossils. Deep Time gave the history of Earth enough time—4.543 billion years—to encompass continental drift, the evolution of species, and the fossilization process. A second Scotsman, Charles Lyell, propelled Hutton’s work into his own theory of uniformitarianism, the doctrine that Earth’s geologic formations are the work of slow geologic forces. Lyell’s three-volume work, Principles of Geology (1830–1833), was influential to naturalist Charles Darwin (see Chapter 2 for more information on Darwin’s work). In fact, Lyell’s first volume accompanied Darwin on his five-year voyage around the world on the HMS Beagle (1831–1836). The concepts proposed by Lyell gave Darwin an opportunity to apply his working theories of evolution by natural selection and a greater length of time with which to work. These resulting theories were important scientific discoveries and paved the way for the “Age of Wonder” (Holmes 2010, xvi).
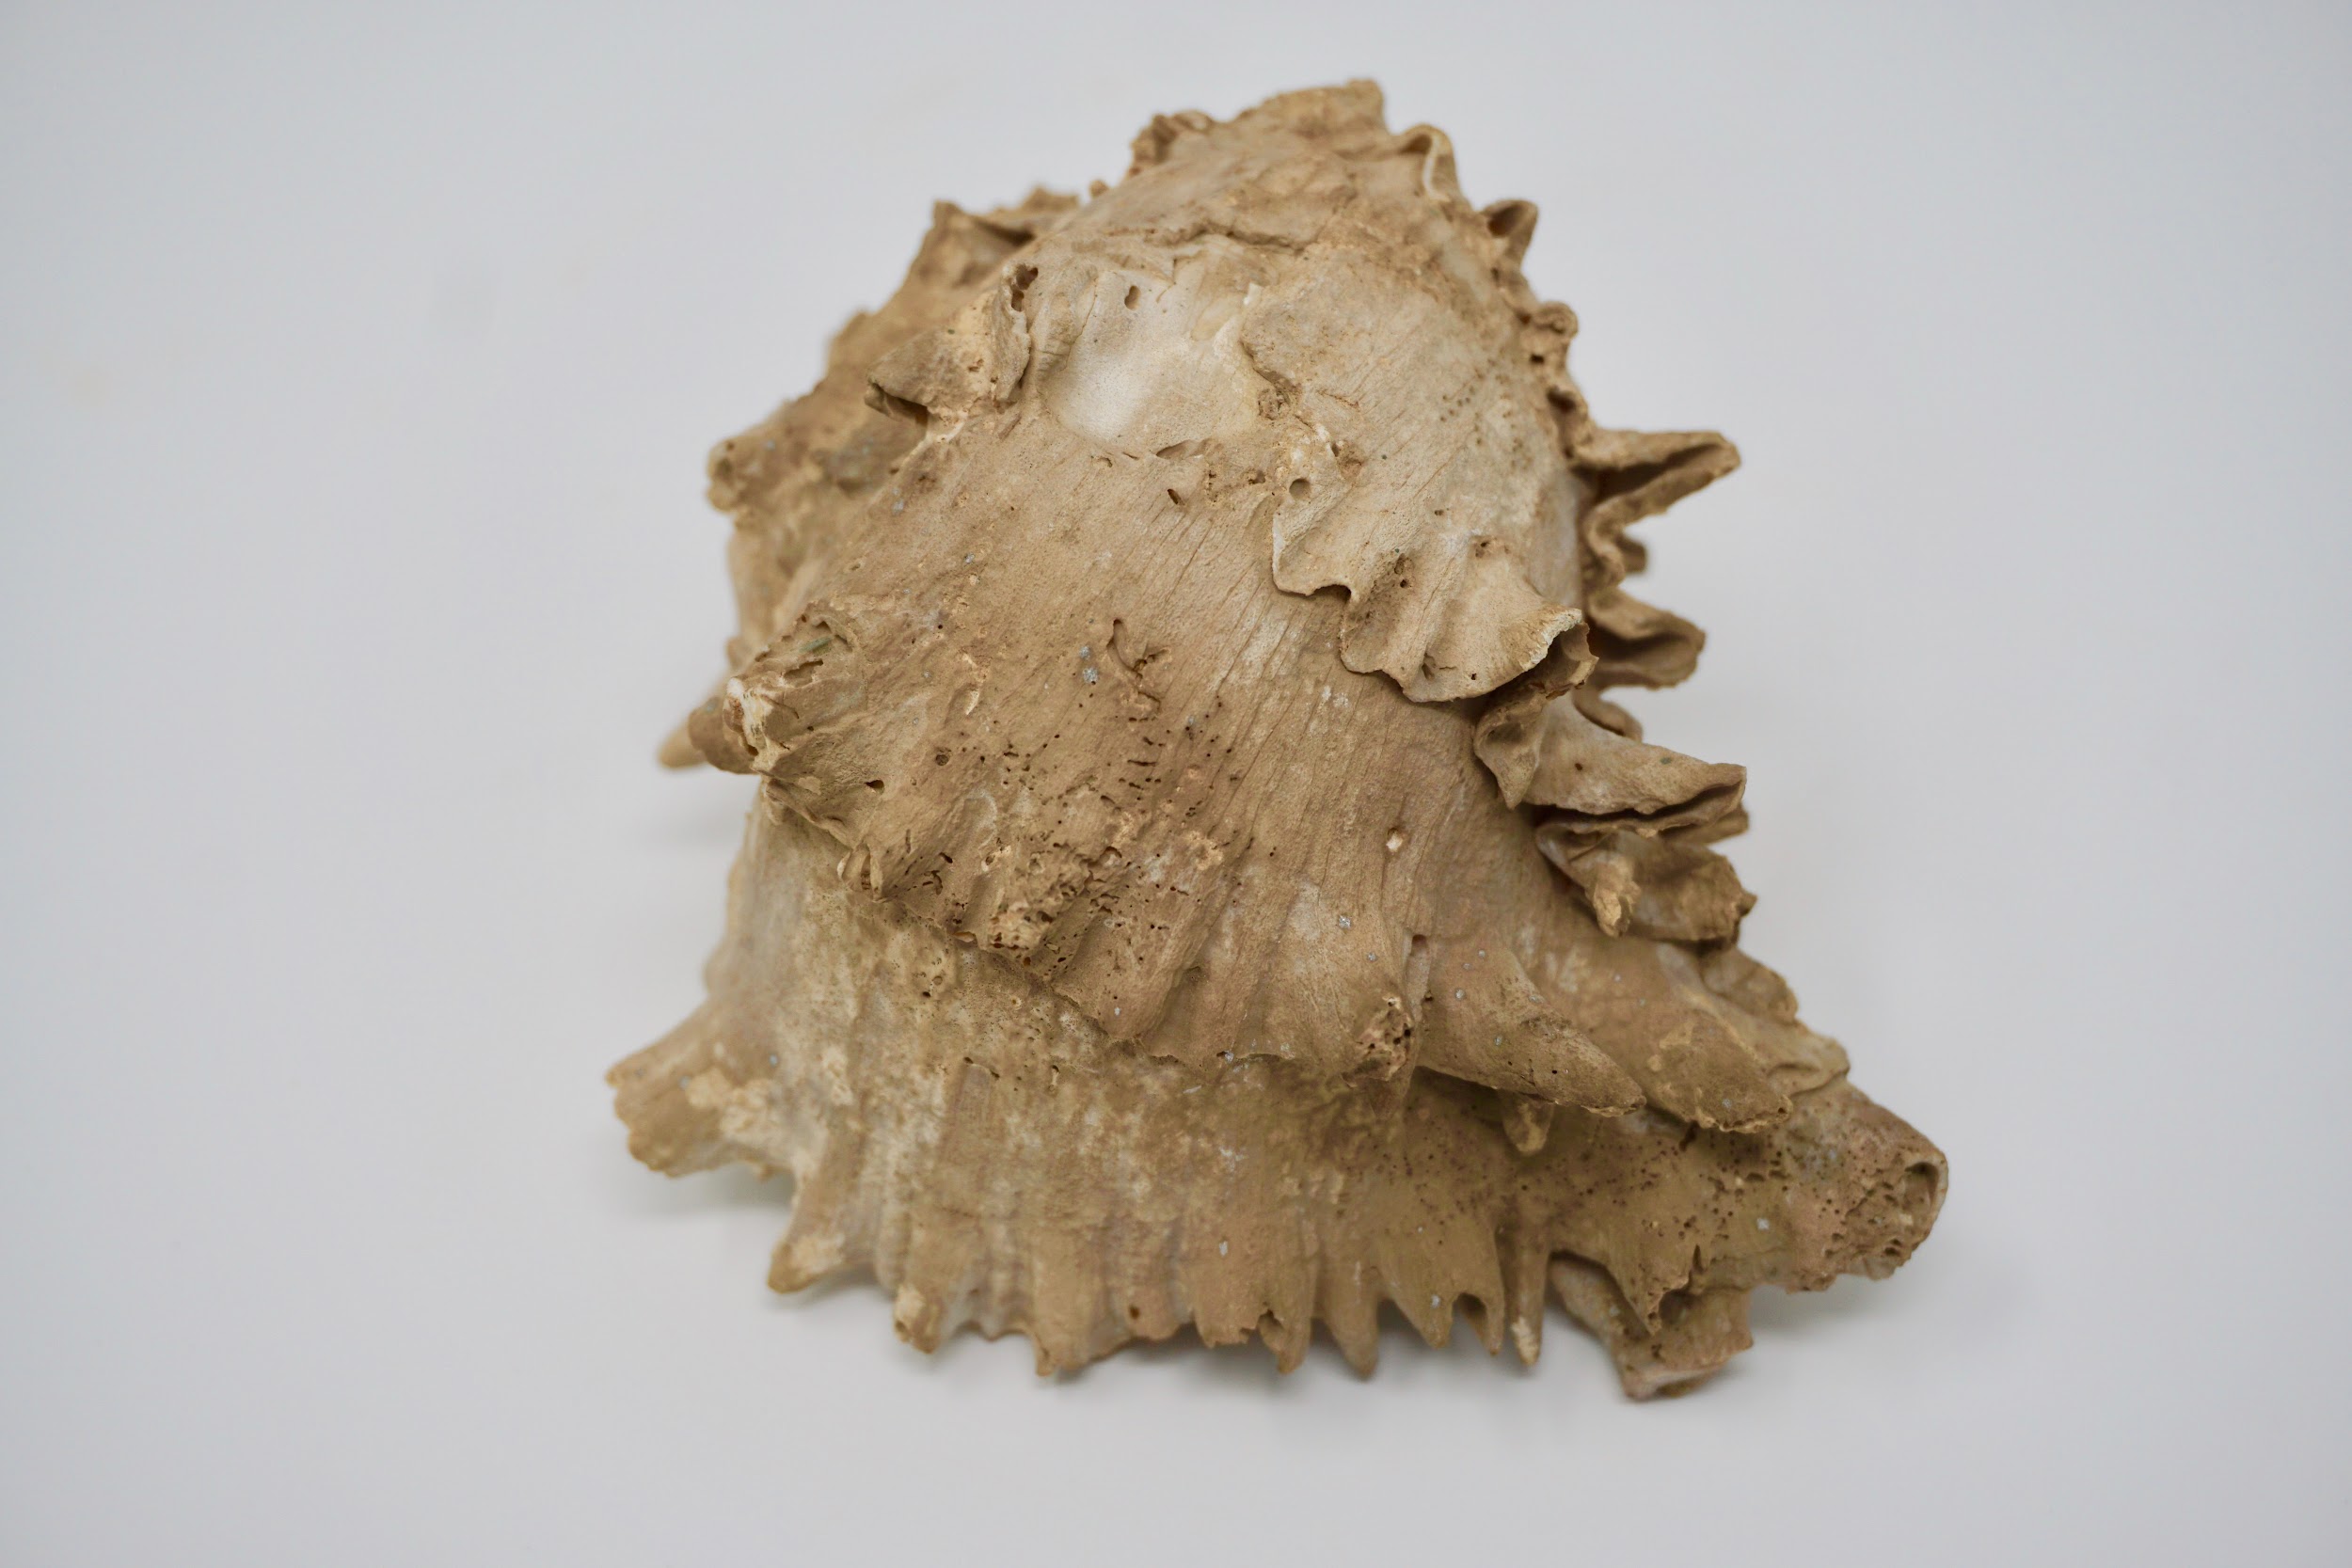
The work of Anning, Darwin, Lyell, and many others laid the foundation for the modern methods we use today. Though anthropology is focused on humans and our primate relatives (and not on dinosaurs, as many people wrongly assume), you will see that methods developed in paleontology, geology, chemistry, biology, and physics are often applied in anthropological research. In this chapter, you will learn about the primary methods and techniques employed by biological anthropologists to answer questions about fossils, the mineralized copies of once-living organisms (Figure 7.5). Ultimately, these answers provide insights into human evolution. Pay close attention to ways in which modern biological anthropologists use other disciplines to analyze evidence and reconstruct past activities and environments.
Earth: It’s Older than Dirt
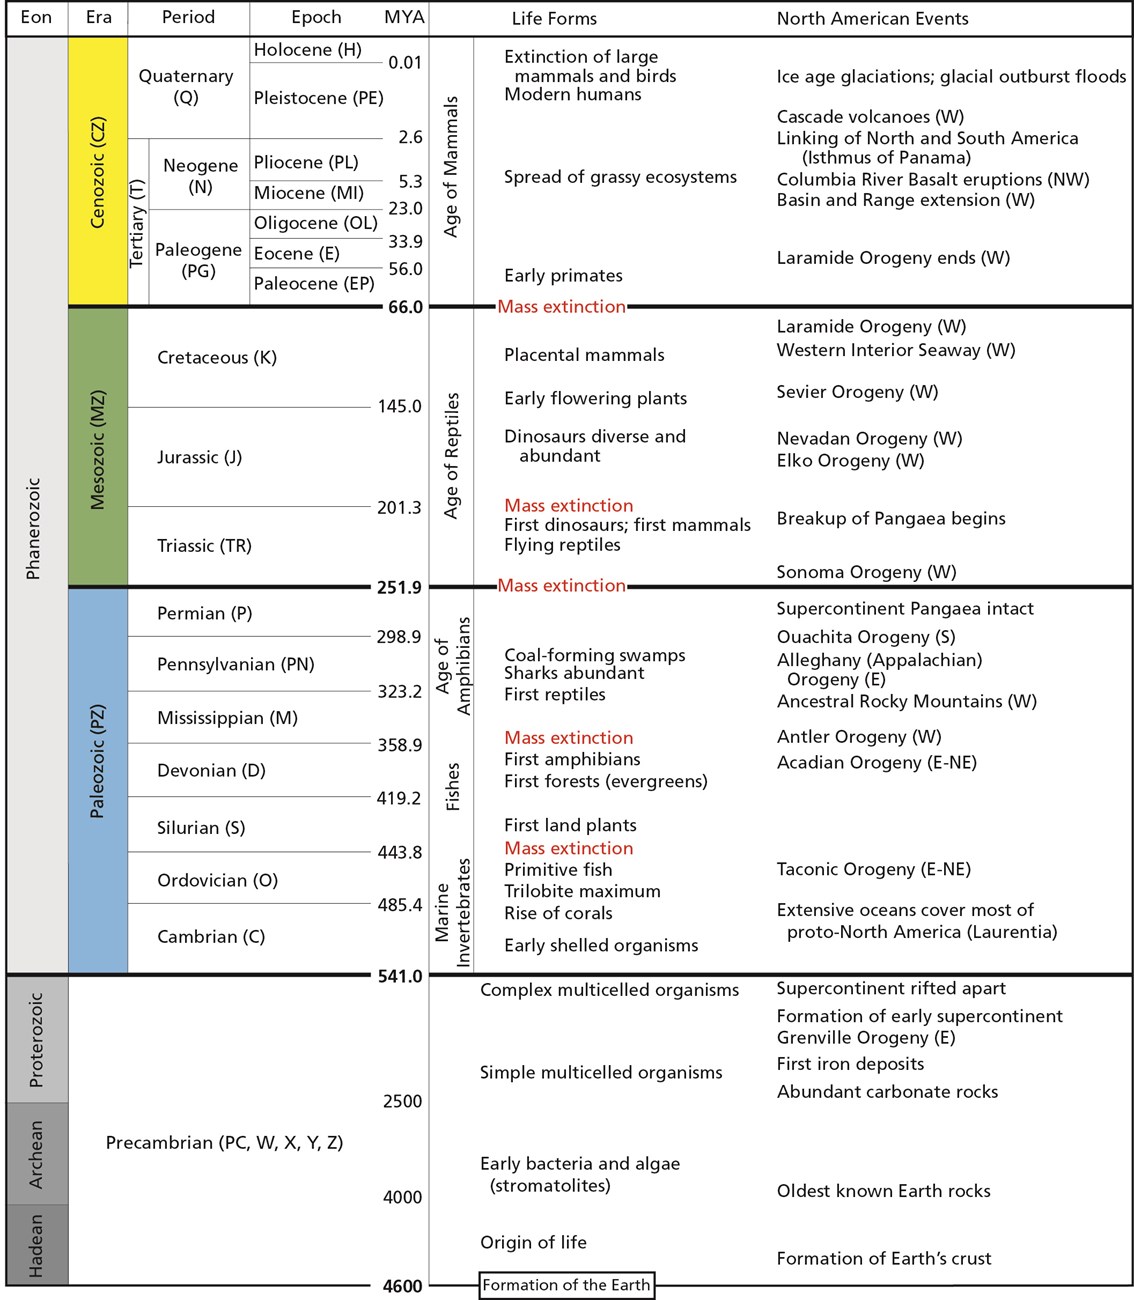
Scientists have developed precise and accurate dating methods based on work in the fields of physics and chemistry. Using these methods, scientists are able to establish the age of Earth as well as approximate ages of the organisms that have lived here. Earth is roughly 4.6 billion years old, give or take a few hundred million years. The first evidence for a living organism appeared around 3.5 billion years ago (bya). The scale of geologic time can seem downright overwhelming. In order to organize and make sense of Earth’s past, geologists break up that time into subunits, which are human-made divisions along Earth’s timeline. The largest subunit is the eon. An eon is further divided into eras, and eras are divided into periods. Finally, periods are divided into epochs (see Figure 7.6; Williams 2004, 37). Currently, we are living in the Phanerozoic eon, Cenozoic era, Quaternary period, and probably the Holocene epoch—though there is academic debate about the current epoch (see below).
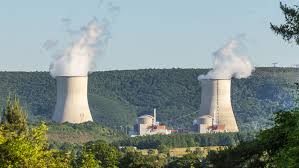
These divisions are based on major changes and events recorded in the geologic record. Events like significant shifts in climate or mass extinctions can be used to mark the end of one geologic time unit and the beginning of another. However, it is important to remember that these borders are not real in a physical sense; they are helpful organizational guidelines for scientific research. There can be debate regarding how the boundaries are defined. Additionally, the methods we use to establish these dates are refined over time, occasionally leading to shifts in established chronology (see the discussion on calibration in the radiocarbon dating section below). For instance, the current epoch has been traditionally known as the Holocene. It began almost twelve thousand years ago (kya) during the warming period after that last major ice age. Today, there is evidence to indicate human-driven climate change is warming the world and changing the environmental patterns faster than the natural cyclical processes. This has led some scientists within the stratigraphic community to argue for a new epoch beginning around 1950 with the Nuclear Age called the Anthropocene (Monastersky 2015; Waters et al. 2016). Nobel Laureate Paul Crutzen places the beginning of the Anthropocene much earlier—at the dawn of the Industrial Revolution, with its polluting effects of burning coal (Crutzen and Stoermer 2000, 17–18). Geologist William Ruddiman argues that the epoch began 5,000–8,000 years ago with the advent of agriculture and the buildup of early methane gasses (Ruddiman et al. 2008). Regardless of when the Anthropocene started, the major event that marks the boundary is the warming temperatures and mass extinction of nonhuman species caused by human activity (Figure 7.7). Researchers now declare that “human activity now rivals geologic forces in influencing the trajectory of the Earth System” (Steffen et al. 2018, 1).
Fossils: The Taphonomic Process
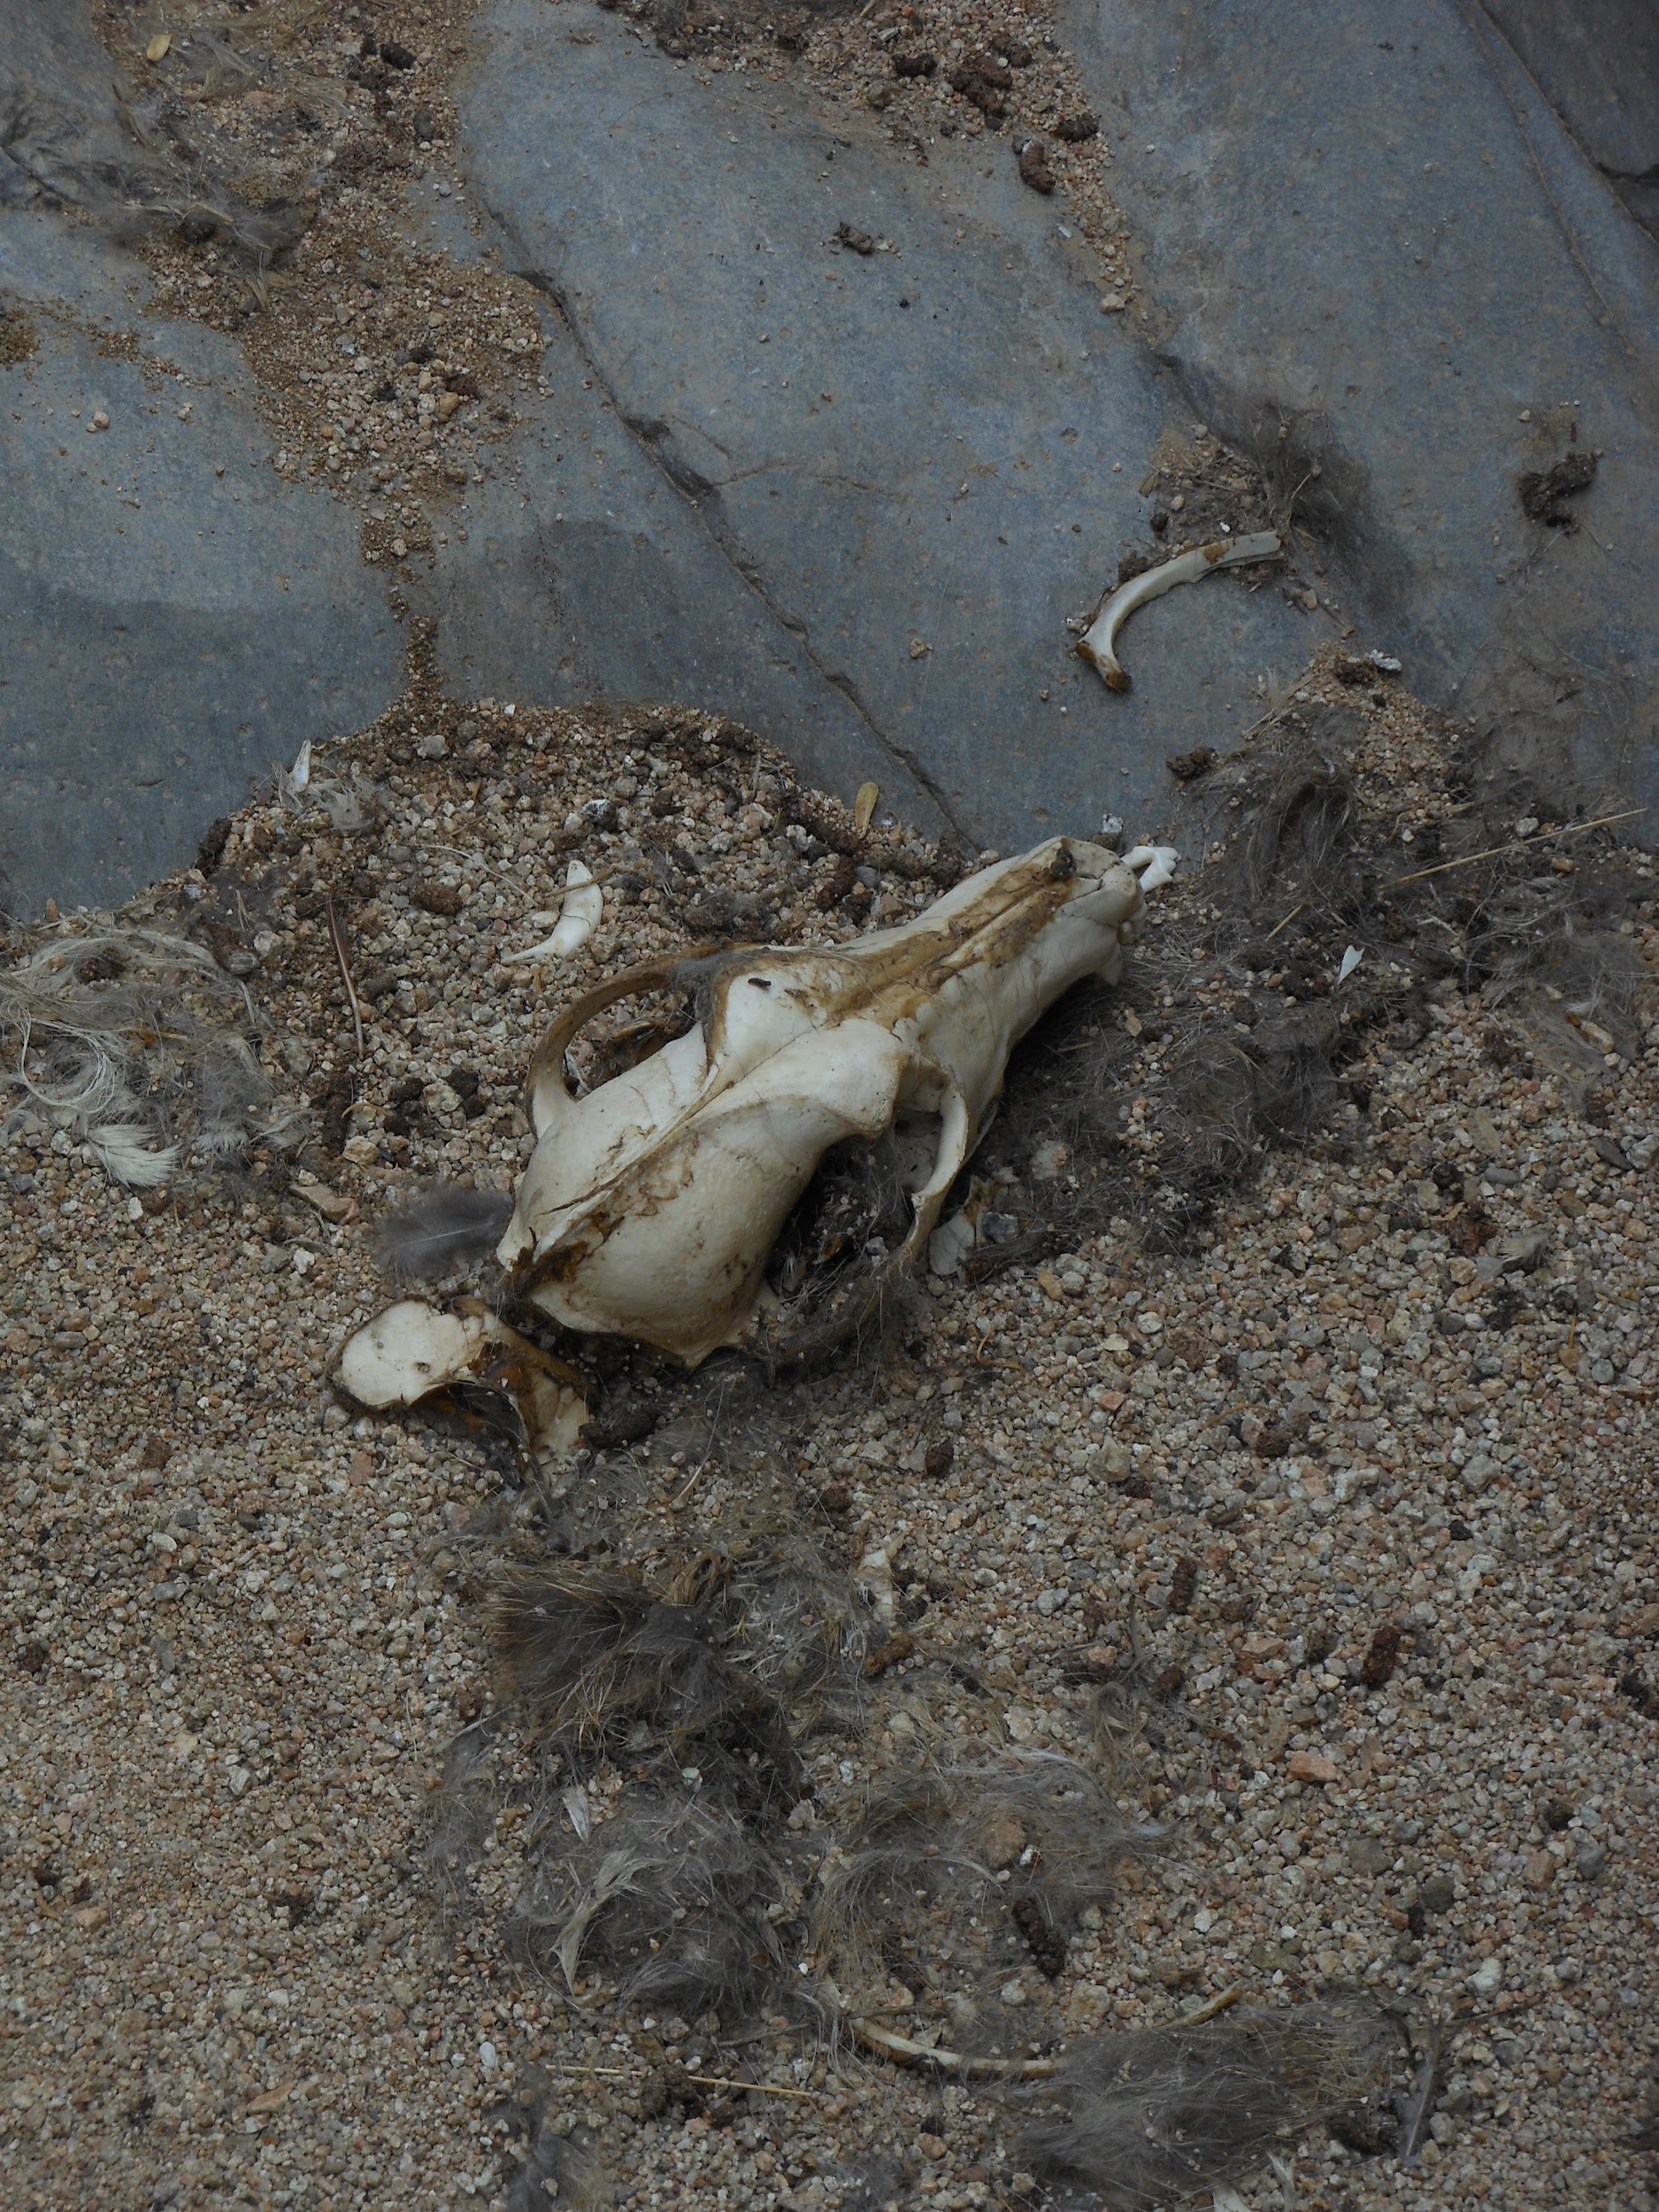
Most of the evidence of human evolution comes from the study of the dead. To obtain as much information as possible from the remains of once-living creatures, one must understand the processes that occur after death. This is where taphonomy comes in (Figure 7.8). Taphonomy is the study of what happens to an organism after death (Komar and Buikstra 2008, 189; Stodder 2008). It includes the study of how an organism becomes a fossil. However, as you’ll see throughout this book, the majority of organisms never make it through the full fossilization process.
Taphonomy is important in biological anthropology, especially in subdisciplines like bioarchaeology (the study of human remains in the archaeological record) and zooarchaeology (the study of faunal remains from archaeological sites). It is so important that many scientists have recreated a variety of burial and decay experiments to track taphonomic change in modern contexts. These contexts can then be used to understand the taphonomic patterns seen in the fossil record (see Reitz and Wing 1999, 122–141).
Taphonomic analysis can also give us important insights into the development of complex thought and ritual in human evolution. In Chapter 11, you will see the first evidence of recognized burial practices in hominins. Taphonomy helped to establish whether these burials were simply the result of natural processes or intentionally constructed by humans (Klein 1999, 395; Straus 1989). Deliberate burials often include the body placed in a specific position, such as supine (on the back) with arms crossed over the chest or in a flexed position (think fetal position) facing a particular direction. If bones have evidence of a carnivore or rodent gnawing on them, it can be inferred that the remains were exposed to scavengers after death.
Going back further in time, taphonomic evidence may tell us how our ancestors died. For instance, several australopithecine fossils show evidence of carnivore tooth marks and even punctures from saber-toothed cats, indicating that we weren’t always the top of the food chain. The Bodo Cranium, a Homo erectus cranium from Middle Awash Valley, Ethiopia, shows cut marks made by stone tools, indicating an early example of possible defleshing activity in our human ancestors (White 1986). At the archaeological site of Zhoukoudian, researchers used taphonomy to show that the highly fragmented remains of at least 51 Homo erectus individuals were scavenged by Pleistocene cave hyenas (Boaz et al. 2004). The damage on Skull VI was described as “elongated, raking bite marks, isolated puncture bite marks, and perimortem breakage consistent with patterns of modern hyaenid bone modification” (Boaz et al. 2004). Additionally, a fresh burnt equid cranium was discovered which supports the theory of mobile hominid scavenging and fire use at the site (Boaz et al. 2004).
Special Topic: Bog Bodies and Mummies
Preservation is a key topic in anthropological research, since we can only study the evidence that gets left behind in the fossil and archaeological record. This chapter is concerned with the fossil record; however, there are other forms of preserved remains that provide anthropologists with information about the past. You’ve undoubtedly heard of mummification, likely in the context of Egyptian or South American mummies. However, bog bodies and ice mummies are further examples of how remains can be preserved in special circumstances. It is important to note that fossilization is a process that takes much longer than the preservation of bog bodies or mummies.
Bog bodies are good examples of wetland preservation. Peat bogs are formed by the slow accumulation of vegetation and silts in ponds and lakes. Individuals were buried in bogs throughout Europe as far back as 10 kya, with a proliferation of activity from 1,600 to 3,200 years ago (Giles 2020; Ravn 2010). When they were found thousands of years later, they resembled recent burials. Their hair, skin, clothing, and organs were exceptionally well preserved, in addition to their bones and teeth (Eisenbeiss 2016; Ravn 2010). Preservation was so good in fact that archaeologists could identify the individuals’ last meals and re-create tattoos found on their skin.
Extreme cold can also halt the natural decay process. A well-known ice mummy is Ötzi, a Copper Age man dating to around 5,200 years ago found in the Alps (Vanzetti et al. 2012; Vidale et al. 2016). As with the bog bodies, his hair, skin, clothing, and organs were all well preserved. Recently, archaeologists were able to identify his last meal (Maixner et al. 2018). It was high in fat, which makes sense considering the extremely cold environment in which he lived, as meals high in fat assist in cold tolerance (Fumagalli et al. 2015).
In the Andes, ancient peoples would bury human sacrifices throughout the high peaks in a sacred ritual called Capacocha (Wilson et al. 2007). The best-preserved mummy to date is called the “Maiden” or “Sarita” because she was found at the summit of Sara Sara Volcano. Her remains are over 500 years old, but she still looks like the 15-year-old girl she was at the time of her death, as if she had just been sleeping for 500 years (Reinhard 2006).
Finally, arid environments can also contribute to the preservation of organic remains. As discussed with waterlogged sites, much of the bacteria that is active in breaking down bodies is already present in our gut and begins the putrefaction process shortly after death. Arid environments deplete organic material of the moisture that putrefactive bacteria need to function (Booth et al. 2015). When that occurs, the soft tissue like skin, hair, and organs can be preserved. It is similar to the way a food dehydrator works to preserve meat, fruit, and vegetables for long-term storage. There are several examples of arid environments spontaneously preserving human remains, including catacomb burials in Austria and Italy (Aufderheide 2003, 170, 192–205).
Fossilization
Fossils only represent a tiny fraction of creatures that existed in the past. It is extremely difficult for an organism to become a fossil. After all, organisms are designed to deteriorate after they die. Bacteria, insects, scavengers, weather, and environment all aid in the process that breaks down organisms so their elements can be returned to Earth to maintain ecosystems (Stodder 2008). Fossilization, therefore, is the preservation of an organism against these natural decay processes (Figure 7.9).
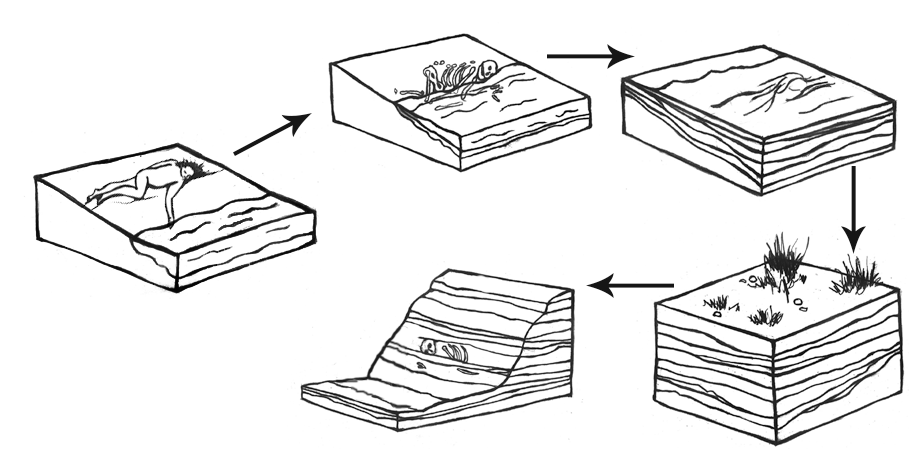
For fossilization to occur, several important things must happen. First, the organism must be protected from things like bacterial activity, scavengers, and temperature and moisture fluctuations. A stable environment is important. This means that the organism should not be exposed to significant fluctuations in temperature, humidity, and weather patterns. Changes to moisture and temperature cause the organic tissues to expand and contract repeatedly, which will eventually cause microfractures and break down (Stodder 2008). Soft tissue like organs, muscle, and skin are more easily broken down in the decay process; therefore, they are less likely to be preserved. Bones and teeth, however, last much longer and are more common in the fossil record (Williams 2004, 207).
Wetlands are a particularly good area for preservation because they allow for rapid permanent burial and a stable moisture environment. That is why many fossils are found in and around ancient lakes and river systems. Waterlogged sites can also be naturally anaerobic (without oxygen). Much of the bacteria that causes decay is already present in our gut and can begin the decomposition process shortly after death during putrefaction (Booth et al. 2015). Since oxygen is necessary for the body’s bacteria to break down organic material, the decay process is significantly slowed or halted in anaerobic conditions.
The next step in the fossilization process is sediment accumulation. The sediments cover and protect the organism from the environment. They, along with water, provide the minerals that will eventually become the fossil (Williams 2004, 31). Sediment accumulation also provides the pressure needed for mineralization to take place. Lithification is when the weight and pressure of the sediments squeeze out extra fluids and replace the voids that appear with minerals from the surrounding sediments. Finally, we have permineralization. This is when the organism is fully replaced by minerals from the sediments. A fossil is really a mineral copy of the original organism (Williams 2004, 31).
Types of Fossils
Plants
Plants make up the majority of fossilized materials. One of the most common plants existing today, the fern, has been found in fossilized form many times. Other plants that no longer exist or the early ancestors of modern plants come in fossilized forms as well. It is through these fossils that we can discover how plants evolved and learn about the climate of Earth over different periods of time.
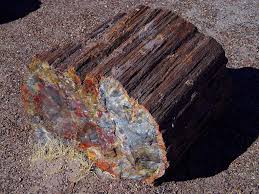
Another type of fossilized plant is petrified wood. This fossil is created when actual pieces of wood—such as the trunk of a tree—mineralize and turn into rock. Petrified wood is a combination of silica, calcite, and quartz, and it is both heavy and brittle. Petrified wood can be colorful and is generally aesthetically pleasing because all the features of the original tree’s composition are illuminated through mineralization (Figure 7.10). There are a number of places all over the world where petrified wood “forests” can be found, but there is an excellent assemblage in Arizona, at the Petrified Forest National Park. At this site, evidence relating to the environment of the area some 225 mya is on display.
Human/Animal Remains
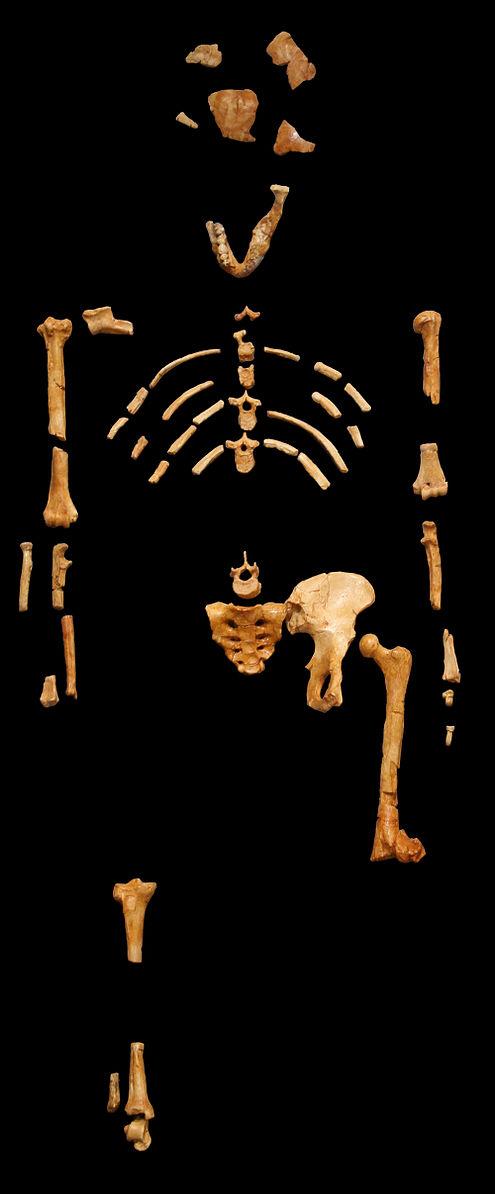
We are more familiar with the fossils of early animals because natural history museums have exhibits of dinosaurs and extinct mammals. However, there are a number of fossilized hominin remains that provide a picture of the fossil record over the course of our evolution from primates. The term hominins includes all human ancestors who existed after the evolutionary split from chimpanzees and bonobos, some six to seven mya. Modern humans are Homo sapiens, but hominins can include much earlier versions of humans. One such hominin is “Lucy” (AL 288-1), the 3.2 million-year-old fossil of Australopithecus afarensis that was discovered in Ethiopia in 1974 (Figure 7.11). Until recently, Lucy was the most complete and oldest hominin fossil, with 40% of her skeleton preserved (see Chapter 9 for more information about Lucy). In 1994, an Australopithecus fossil nicknamed “Little Foot” (Stw 573) was located in the World Heritage Site at Sterkfontein Caves (“the Cradle of Humankind”) in South Africa. Little Foot is more complete than Lucy and possibly the oldest fossil that has so far been found, dating to at least 3.6 million years (Granger et al. 2015). The ankle bones of the fossil were extricated from the matrix of concrete-like rock, revealing that the bones of the ankles and feet indicate bipedalism (University of Witwatersrand 2017).
Both the Lucy and Little Foot fossils date back to the Pliocene (5.8 to 2.3 mya). Older hominin fossils from the late Miocene (7.25 to 5.5 mya) have been located, although they are much less complete. The oldest hominin fossil is a fragmentary skull named Sahelanthropus tchadensis, found in Northern Chad and dating to circa seven mya (Lebatard et al. 2008). It is through the discovery, dating, and study of primate and early hominin fossils that we find physical evidence of the evolutionary timeline of humans.
Asphalt
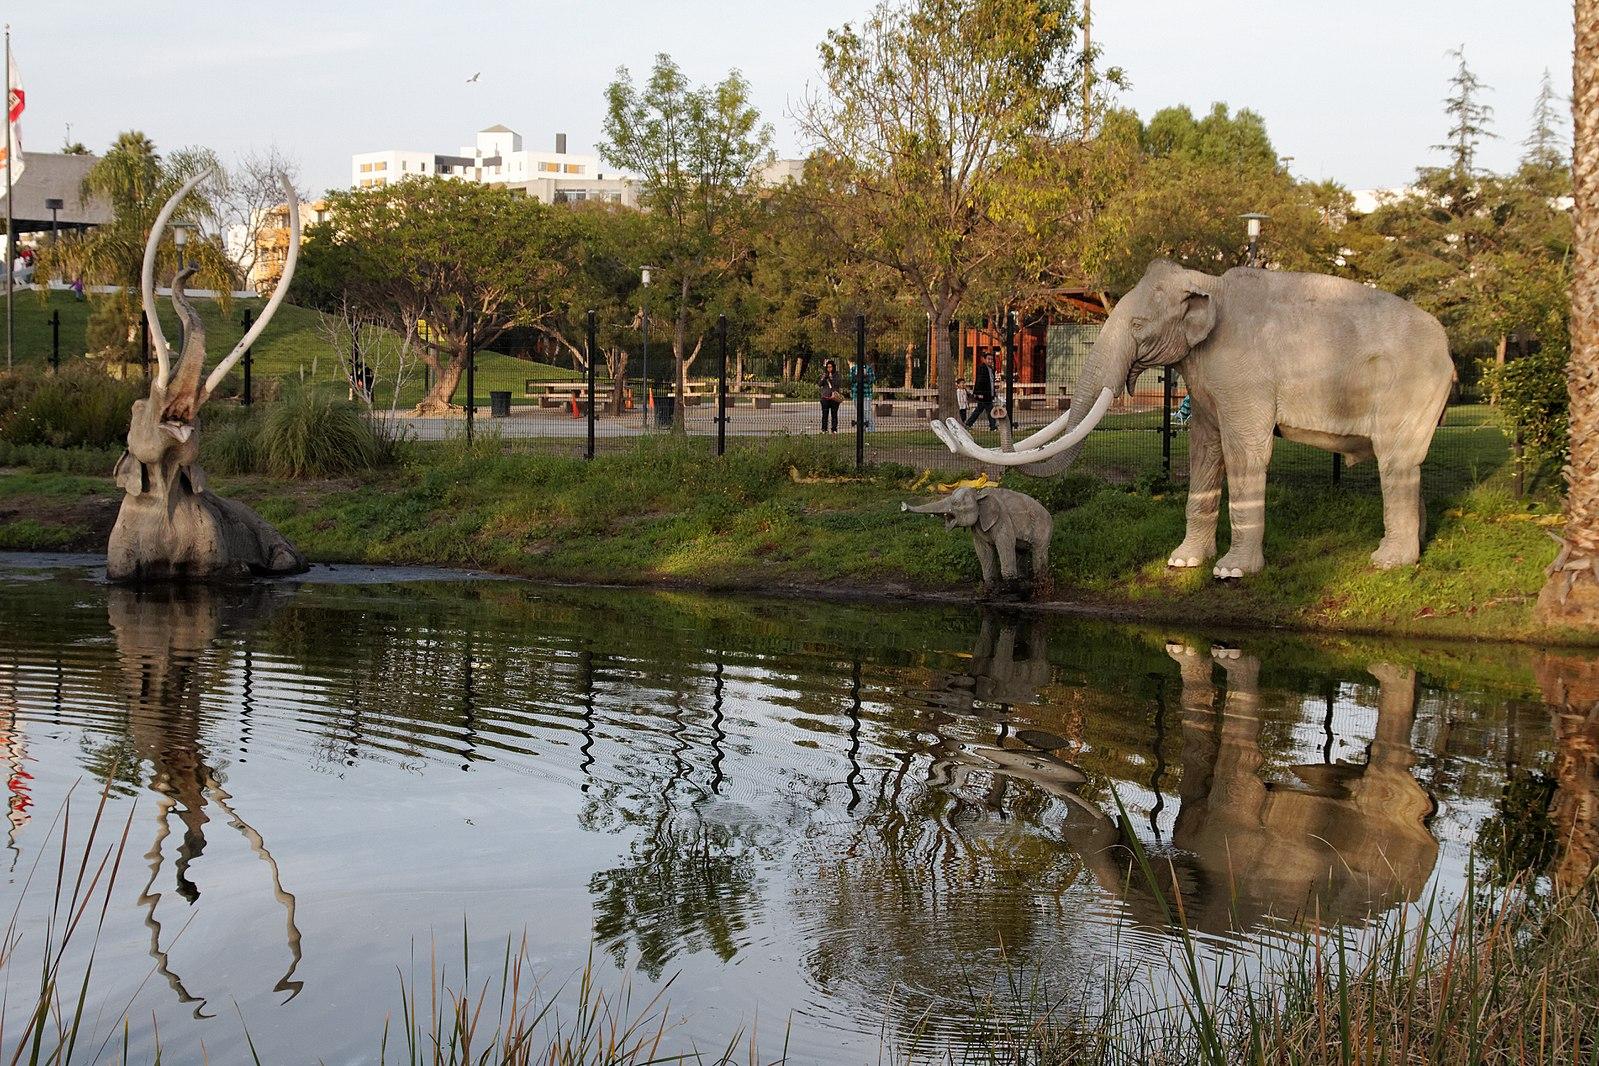
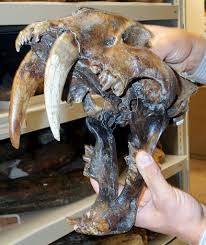
Asphalt, a form of crude oil, can also yield fossilized remains. Asphalt is commonly referred to in error as tar because of its viscous nature and dark color. A famous fossil site from California is La Brea Tar Pits in downtown Los Angeles (Figure 7.12). In the middle of the busy city on Wilshire Boulevard, asphalt (not tar) bubbles up through seeps (cracks) in the sidewalk. The La Brea Tar Pits Museum provides an incredible look at the both extinct and extant animals that lived in the Los Angeles Basin 40,000–11,000 years ago. These animals became entrapped in the asphalt during the Pleistocene and perished in place. Ongoing excavations have yielded millions of fossils, including megafauna such as American mastodons and incomplete skeletons of extinct species of dire wolves, Canis dirus, and the saber-toothed cat, Smilodon fatalis (Figure 7.13). Fossilized remains of plants have also been found in the asphalt. The remains of one person have also been found at the tar pits. Referred to as La Brea Woman, the remains were found in 1914 and were subsequently dated to around 10,250 years ago. The La Brea Woman was a likely female individual who was 17–28 years old at the time of her death, with a height of under five feet (Spray 2022). She is thought to have died from blunt force trauma to her head, famously making her Los Angeles’s first documented homicide victim (Spray 2022). (Learn more about her in the Special Topic box, “Necropolitics,” below.) Between the fossils of animals and those of plants, paleontologists have a good idea of the way the Los Angeles Basin looked and what the climate in the area was like many thousands of years ago.
Igneous Rock
Most fossils are found in sedimentary rock. This type of rock has been formed from deposits of minerals over millions of years in bodies of water on Earth’s surface. Some examples include shale, limestone, and siltstone. Sedimentary rock typically has a layered appearance. However, fossils have been found in igneous rock as well. Igneous rock is volcanic rock that is created from cooled molten lava. It is rare for fossils to survive molten lava, and it is estimated that only 2% of all fossils have been found in igneous rock (Ingber 2012). Part of a giant rhinocerotid skull dating back 9.2 mya to the Miocene was discovered in Cappadocia, Turkey, in 2010. The fossil was a remarkable find because the eruption of the Çardak caldera was so sudden that it simply dehydrated and “baked” the animal (Antoine et al. 2012).
Trace Fossils
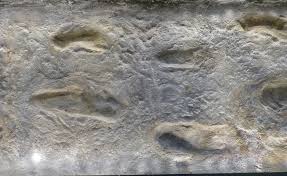
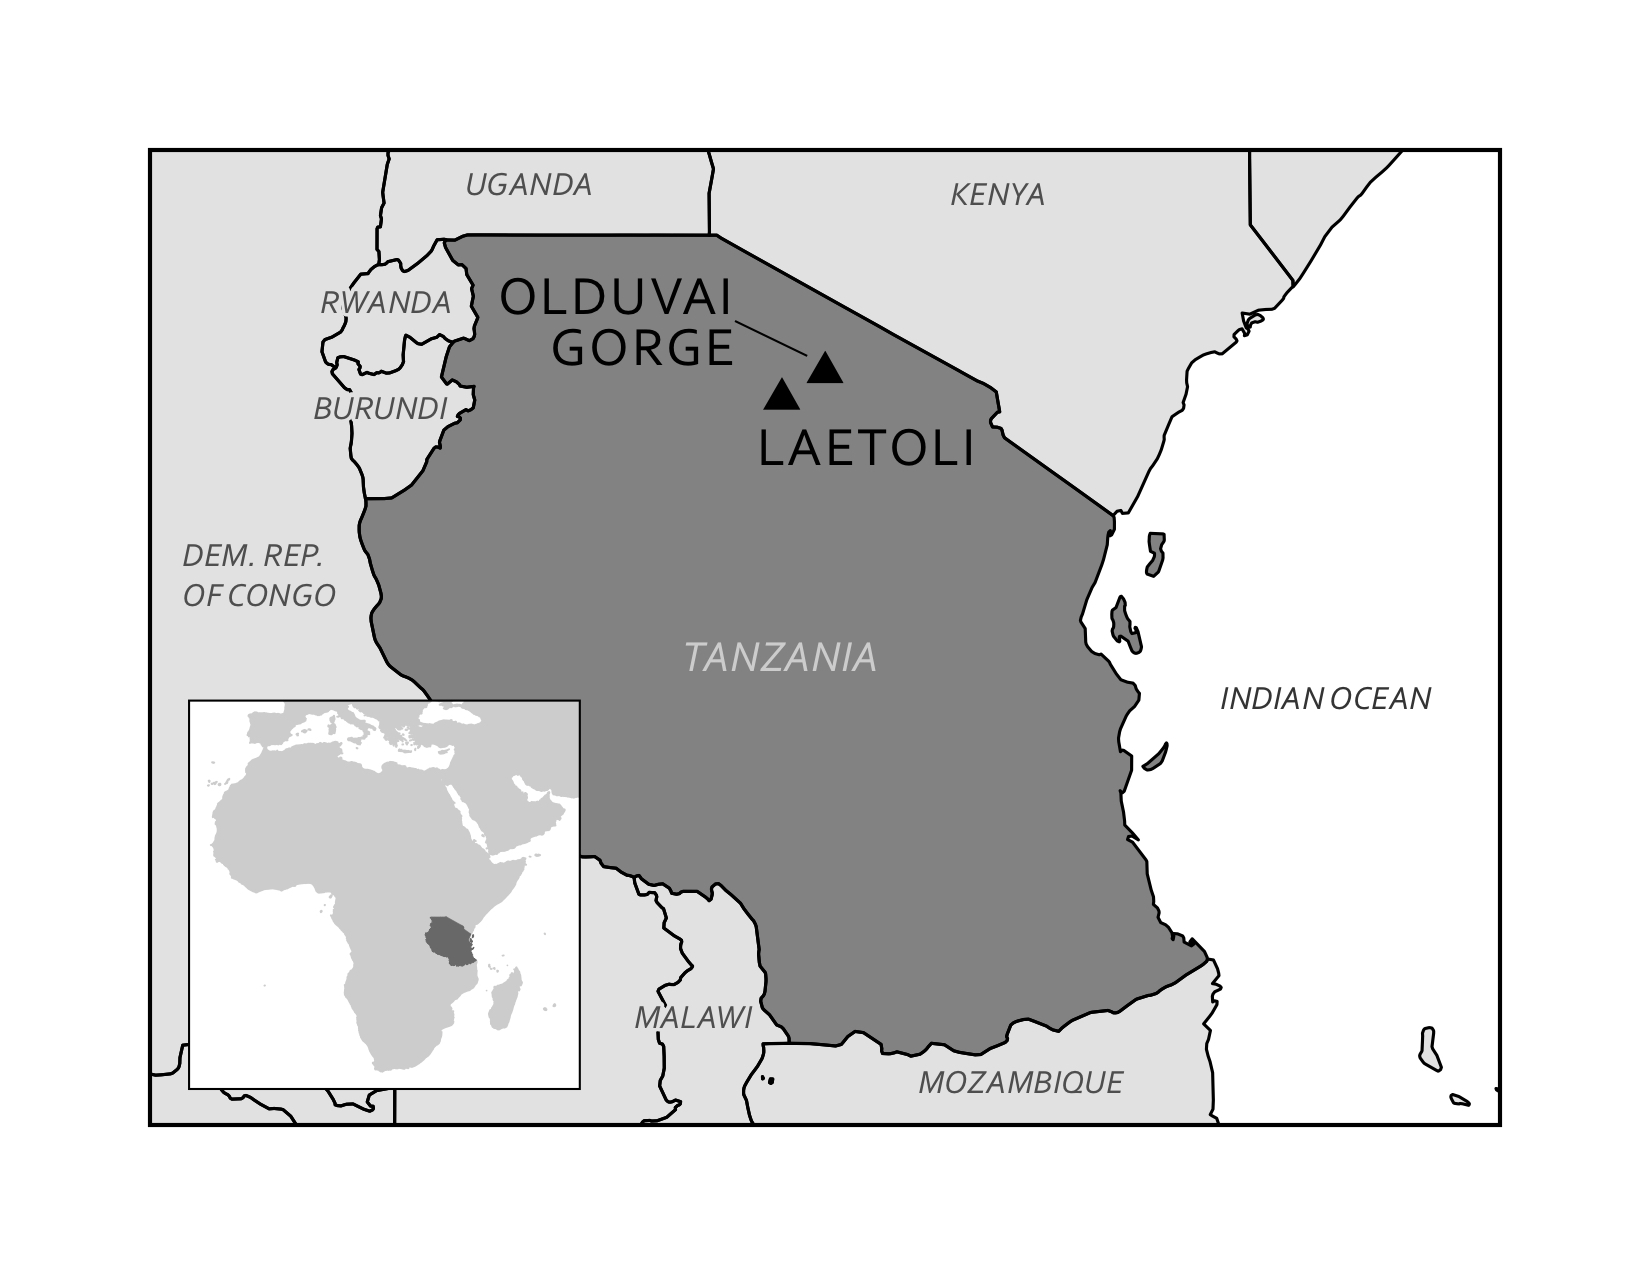
Depending on the specific circumstances of weather and time, even footprints can become fossilized. Footprints fall into the category of trace fossils, which includes other evidence of biological activity such as nests, burrows, tooth marks, and shells. A well-known example of trace fossils are the Laetoli footprints in Tanzania (Figure 7.14). More recently, archaeological investigations in North America have revealed fossil footprints which rewrite the history of people in the Americas at White Sands, New Mexico. You can read more about the Laetoli and White Sands footprints in the Dig Deeper box below.
Other fossilized footprints have been discovered around the world. At Pech Merle cave in the Dordogne region of France, archaeologists discovered two fossilized footprints. They then brought in indigenous trackers from Namibia to look for other footprints. The approach worked, as many other footprints belonging to as many as five individuals were discovered with the expert eyes of the trackers (Pastoors et al. 2017). These footprints date back 12,000 years (Granger Historical Picture Archive 2018).
Some of the more unappealing but still-fascinating trace fossils are bezoars and coprolite. Bezoars are hard, concrete-like substances found in the intestines of fossilized creatures. Bezoars start off like the hair balls that cats and rabbits accumulate from grooming, but they become hard, concrete-like substances in the intestines. If an animal with a hairball dies before expelling the hair ball mass and the organism becomes fossilized, that mass becomes a bezoar.
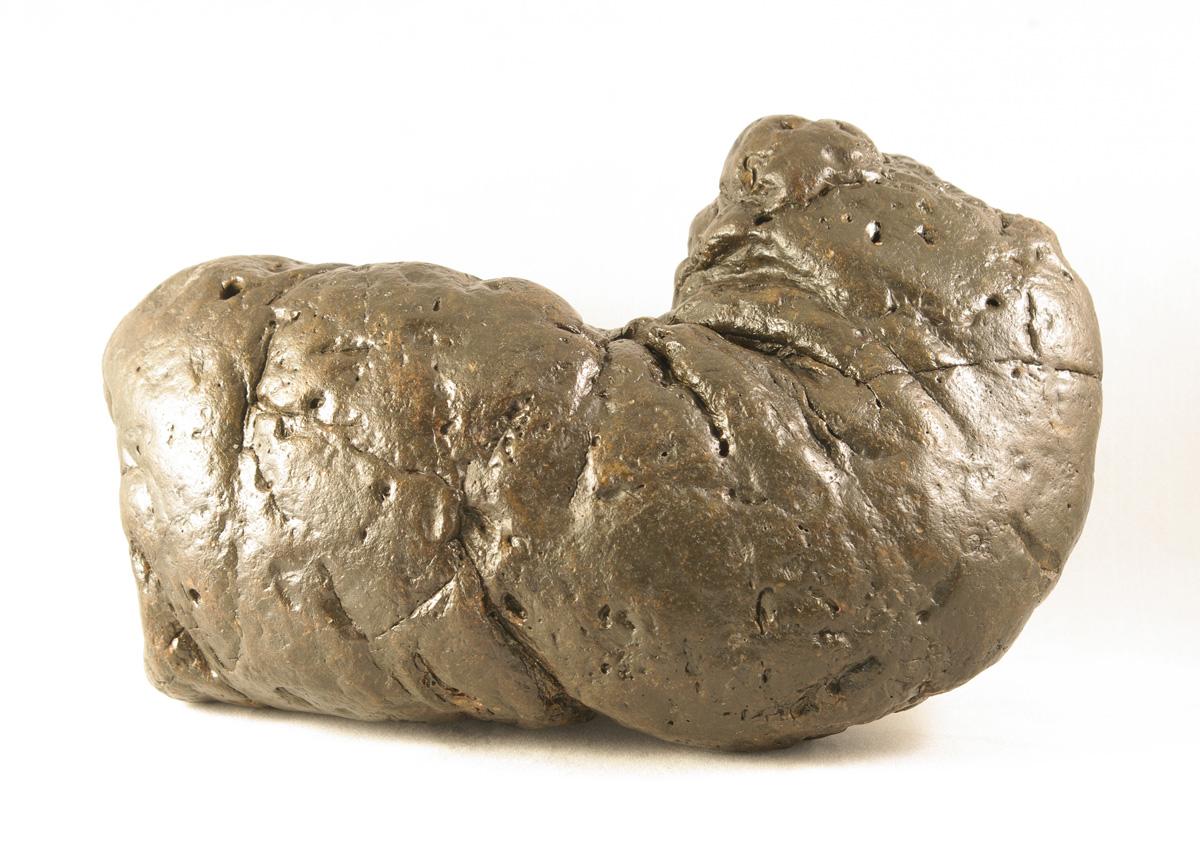
Coprolite is fossilized dung. One of the best collections of coprolites is affectionately known as the “Poozeum.” The collection includes a huge coprolite named “Precious” (Figure 7.15). Coprolite, like all fossilized materials, can be in matrix—meaning that the fossil is embedded in secondary rock. As unpleasant as it may seem to work with coprolites, remember that the organic material in dung has mineralized or has started to mineralize; therefore, it is no longer soft and is generally not smelly. Also, just as a doctor can tell a lot about health and diet from a stool sample, anthropologists can glean a great deal of information from coprolite about the diets of ancient animals and the environment in which the food sources existed. For instance, 65 million-year-old grass phytoliths (microscopic silica in plants) found in dinosaur coprolite in India revealed that grasses had been in existence much earlier than scientists initially believed (Taylor and O’Dea 2014, 133).
Pseudofossils
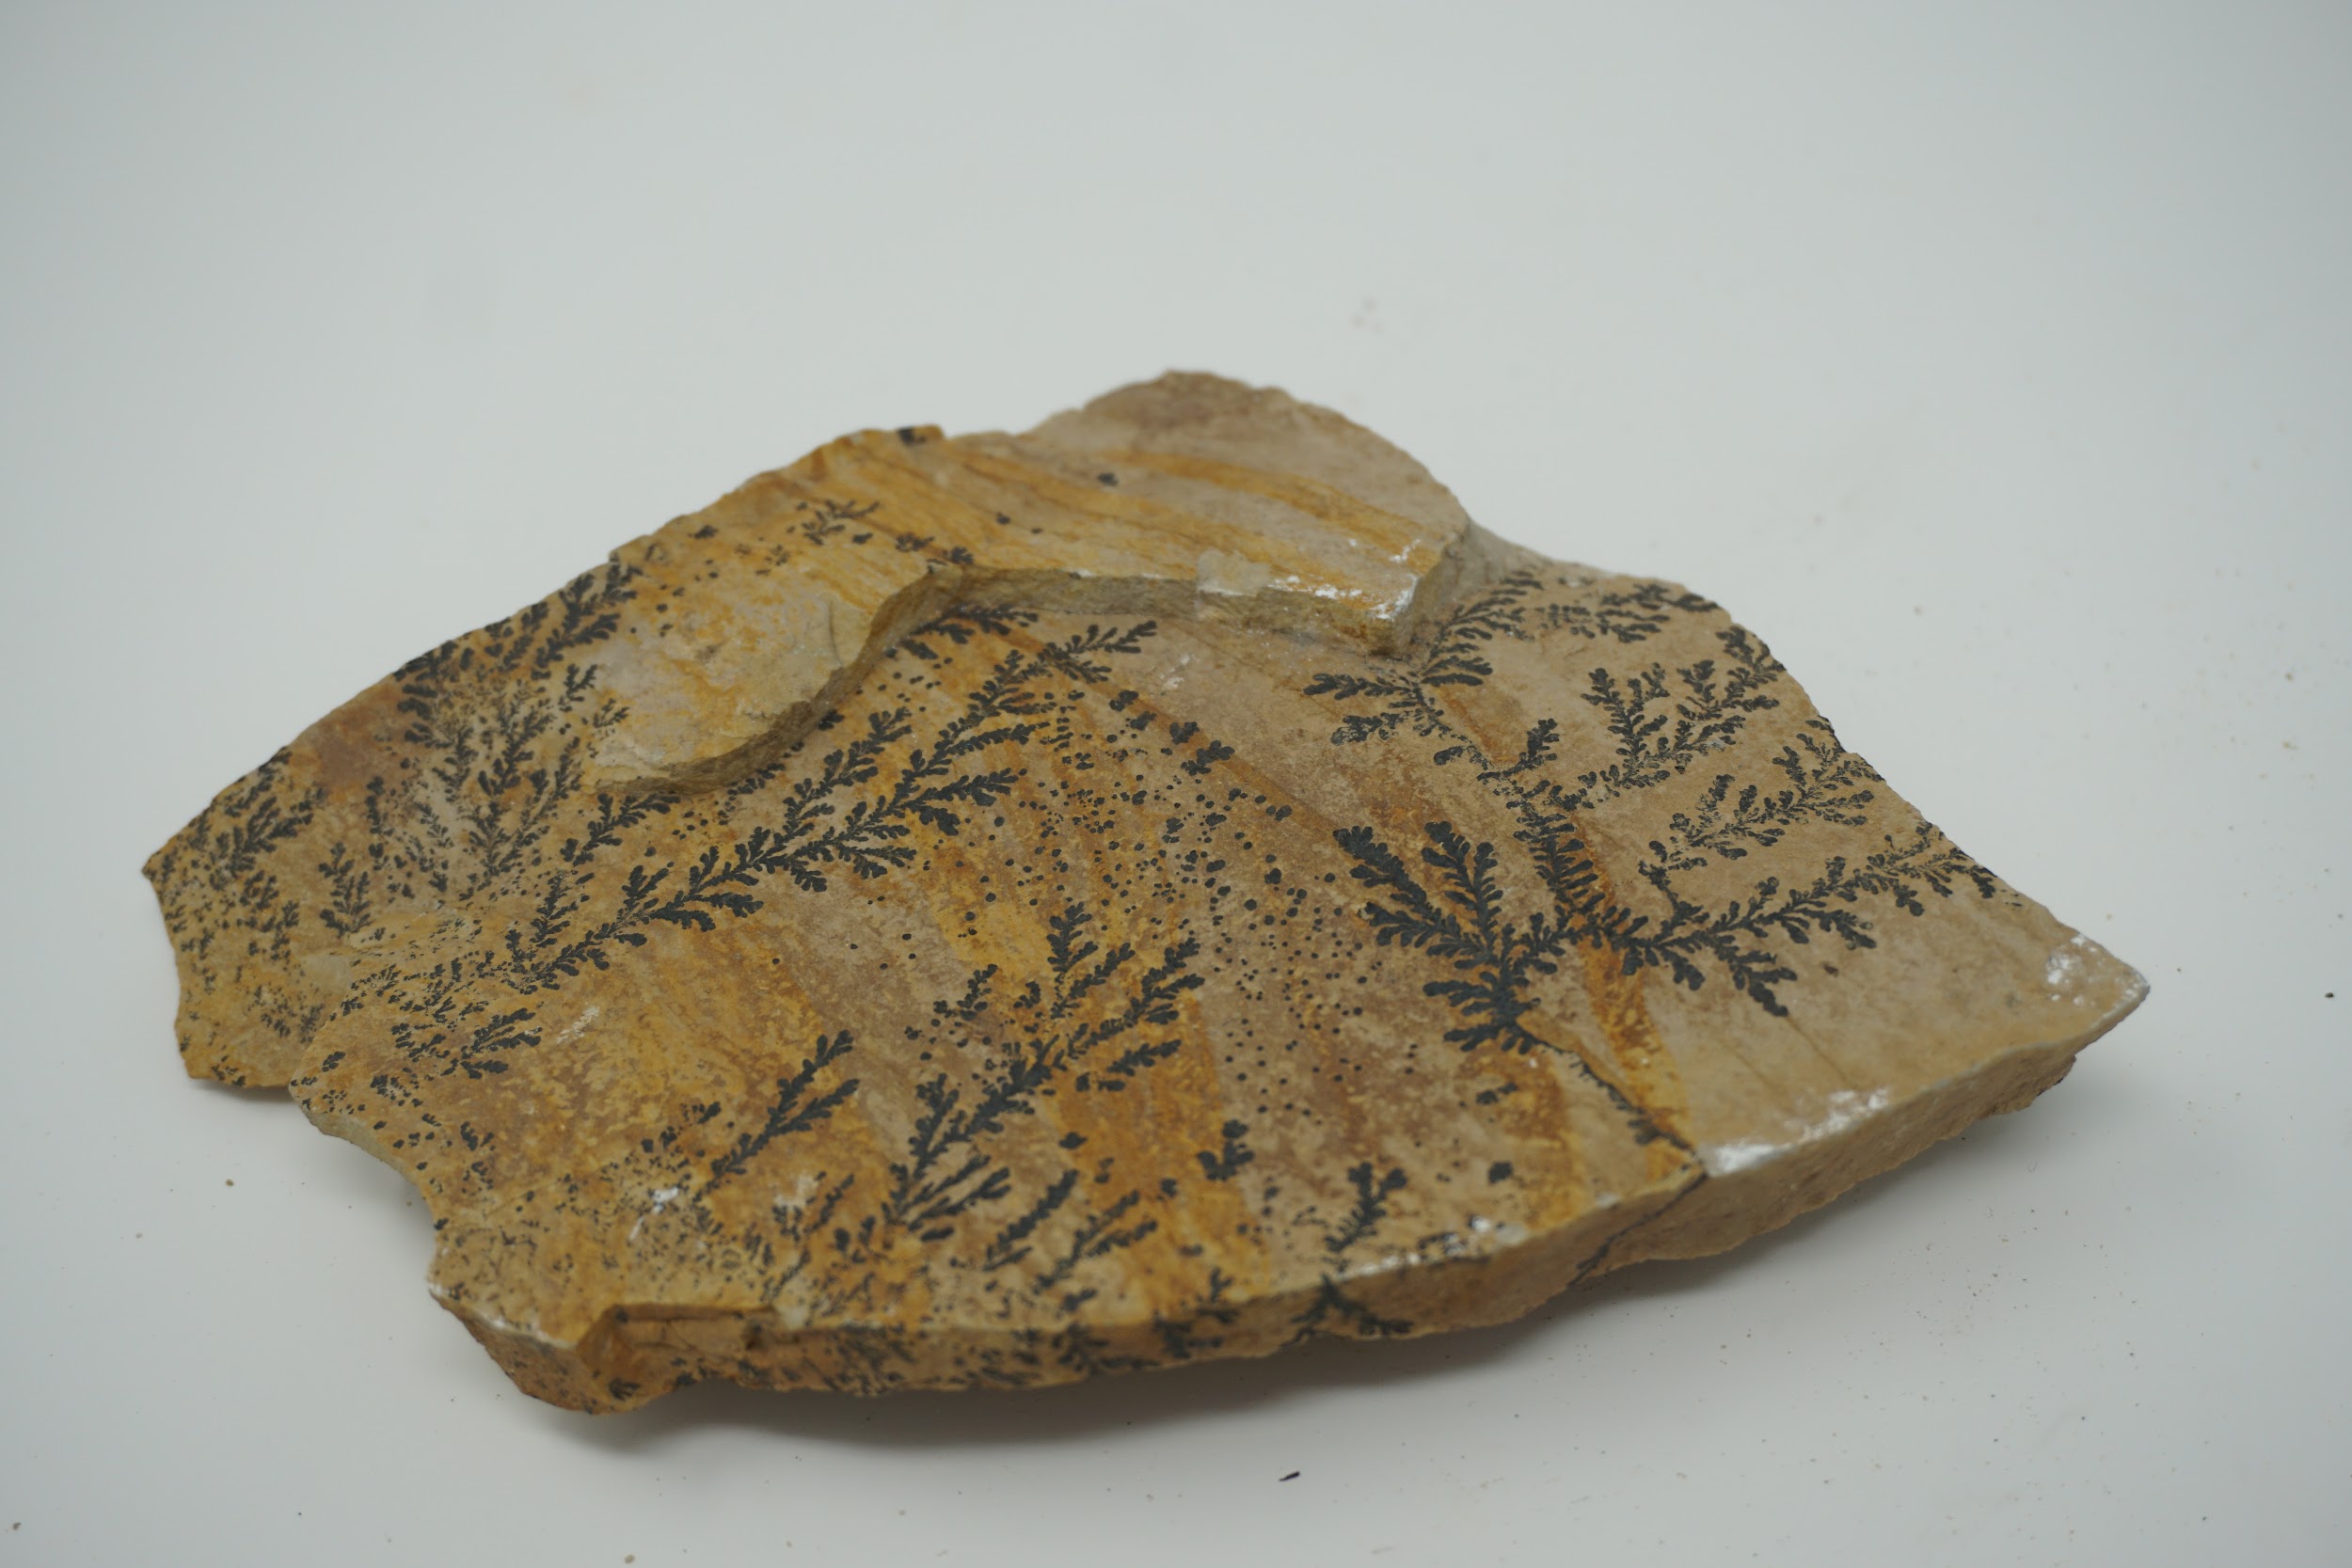
Pseudofossils are not to be mistaken for fake fossils, which have vexed scientists from time to time. A fake fossil is an item that is deliberately manipulated or manufactured to mislead scientists and the general public. In contrast, pseudofossils are not misrepresentations but rather misinterpretations of rocks that look like true fossilized remains (S. Brubaker, personal communication, March 9, 2018). Pseudofossils are the result of impressions or markings on rock, or even the way other inorganic materials react with the rock. A common example is dendrites, the crystallized deposits of black minerals that resemble plant growth (Figure 7.16). Other examples of pseudofossils are unusual or odd-shaped rocks that include various concretions and nodules. An expert can examine a potential fossil to see if there is the requisite internal structure of organic material such as bone or wood that would qualify the item as a fossil.
Dig Deeper: Trace Fossils
The Power of Poop
Coprolites found in Paisley Caves, Oregon, in the United States are shedding new light on some of the earliest occupants in North America. Human coprolites are distinguished from animal coprolites through the identification of fecal biomarkers using lipids, or fats, and bile acids (Shillito et al. 2020a). Paisley Caves have 16,000 years of anthropogenic, or human-caused, deposition, with some coprolites having been dated as old as 12.8kya (Blong et al. 2020). Over 285 radiocarbon dates have been recorded from the site (Shillito et al. 2020a), making Paisley Caves one of the most well-dated archaeological sites in the United States. Coprolite analysis can be summarized in three levels, macroscopic, microscopic, and molecular. This can also be understood as analyzing the morphology (macroscopic), contents (microscopic), and residues (molecular) (Shillito et al. 2020b). Each of these levels adds a different layer of information. Coprolite shape is informative through what can be seen macroscopically, such as ingestions of basketry or cordage, small gravels and grains, and general shape. The contents of coprolites may be of the most interest to scientists because certain plants and animals can signal past environments as well as food procurement methods. Coprolites from Paisley Caves have included small pebbles and obsidian chips from butchering game, grinding plants, and general food preparation as well as small bits of fire cracked rock likely from cooking in hearths (Blong 2020). Additionally, rodent bones in coprolites included crania and vertebrae, which suggests whole consumption (Taylor et al. 2020). Insect remains are present in the coprolites as well, such as ants, Jerusalem crickets, June beetles, and darkling beetles (Blong 2020). In all, the coprolites of Paisley Caves have provided an invaluable resource to anthropologists to study the past climate and lifeways of early humans in the Americas.
Coprolites can also signal past health, which is a study known as paleopathology. A study by Katelyn McDonough and colleagues (2022) focused on the identification of parasites in coprolites at Bonneville Estates Rockshelter in eastern Nevada and their link to the greater Great Basin during the Archaic, a period of time spanning 8,000–5,000 years ago. According to the study, parasites such as Acanthocephalans (thorny-headed worms) have been affecting the Great Basin for at least the last 10,000 years. Acanthocephalans are endoparasites, meaning parasites that live inside of their hosts. They are found worldwide and seem to have been concentrated in the Great Basin in the past. Bonneville Estates Rockshelter has been visited by humans for over 13,000 years, with parasite identification going back to nearly 7,000 years. The species identified at Bonneville Estates is Moniliformis clarki. This species parasitizes crickets and insects, a popular food source during the Archaic in the Great Basin. The parasite uses intermediate hosts to get to mammals and birds as definitive hosts. Crickets and beetles have been recorded as food materials in Paisley Caves as well. Insects have remained an important dietary staple for people of the Great Basin and are consumed raw, dried, brined, or ground into flour. Insects that remain uncooked or undercooked have a higher risk for transmission of parasites. Symptoms associated with Acanthocephalans infection are intense intestinal discomfort, anemia, and anorexia, leading to death. It is hypothesized that the consumption of basketry, cordage, and charcoal (which was also identified at Paisley Caves), sometimes associated with parasite-infected coprolites, may have been a method of treatment for the infection. Interestingly, present day infections from this parasite are rising after remaining quite rare, as detection of the parasite is occurring in insect farms.
Walking to the Past
In 1974, British anthropologist Mary Leakey discovered fossilized animal tracks at Laetoli (Figure 7.17), not far from the important paleoanthropological site at Olduvai Gorge in Tanzania. A few years later, a 27-meter trail of hominin footprints were discovered at the same site. These 70 footprints, now referred to as the Laetoli Footprints, were created when early humans walked in wet volcanic ash. Before the impressions were obscured, more volcanic ash and rain fell, sealing the footprints. These series of environmental events were truly extraordinary, but they fortunately resulted in some of the most famous and revealing trace fossils ever found. Dating of the footprints indicate that they were made 3.6 mya (Smithsonian National Museum of Natural History 2018).
Just as forensic scientists can use footprints to identify the approximate build of a potential suspect in a crime, archaeologists have read the Laetoli Footprints for clues to these early humans. The footprints clearly indicate bipedal hominins who had similar feet to those of modern humans. Analysis of the gait through computer simulation revealed that the hominins at Laetoli walked similarly to the way we walk today (Crompton 2012). More recent analyses confirm the similarity to modern humans but also indicate a gait that involved more of a flexed limb than that of modern humans (Hatala et al. 2016; Raichlen and Gordon 2017). The relatively short stride implies that these hominins had short legs—unlike the longer legs of later early humans who migrated out of Africa (Smithsonian National Museum of Natural History 2018). In the context of Olduvai Gorge, where fossils of Australopithecus afarensis have been located and dated to the same timeframe as the footprints, it is likely that these newly discovered impressions were left by these same hominins.
The footprints at Laetoli were made by a small group of as many as three Australopithecus afarensis, walking in close proximity, not unlike what we would see on a modern street or sidewalk. Two trails of footprints have been positively identified with the third set of prints appearing smaller and set in the tracks left by one of the larger individuals. While scientific methods have given us the ability to date the footprints and understand the body mechanics of the hominin, additional consideration of the footprints can lead to other implications. For instance, the close proximity of the individuals implies a close relationship existed between them, not unlike that of a family. Due to the size variation and the depth of impression, the footprints seem to have been made by two larger adults and possibly one child. Scientists theorize that the weight being carried by one of the larger individuals is a young child or a baby (Masao et al. 2016). Excavation continues at Laetoli today, resulting in the discovery of two more footprints in 2015, also believed to have been made by Au. afarensis (Masao et al. 2016).
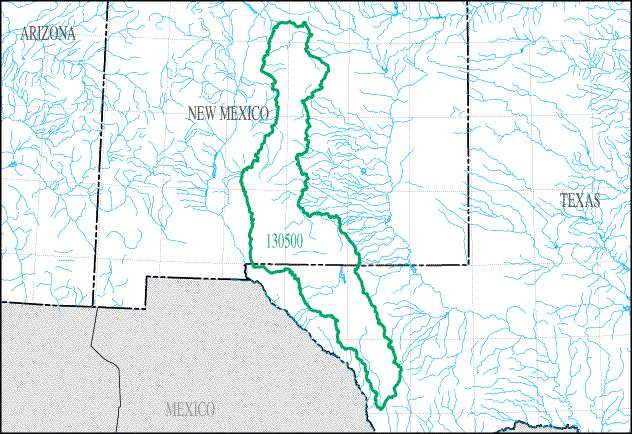
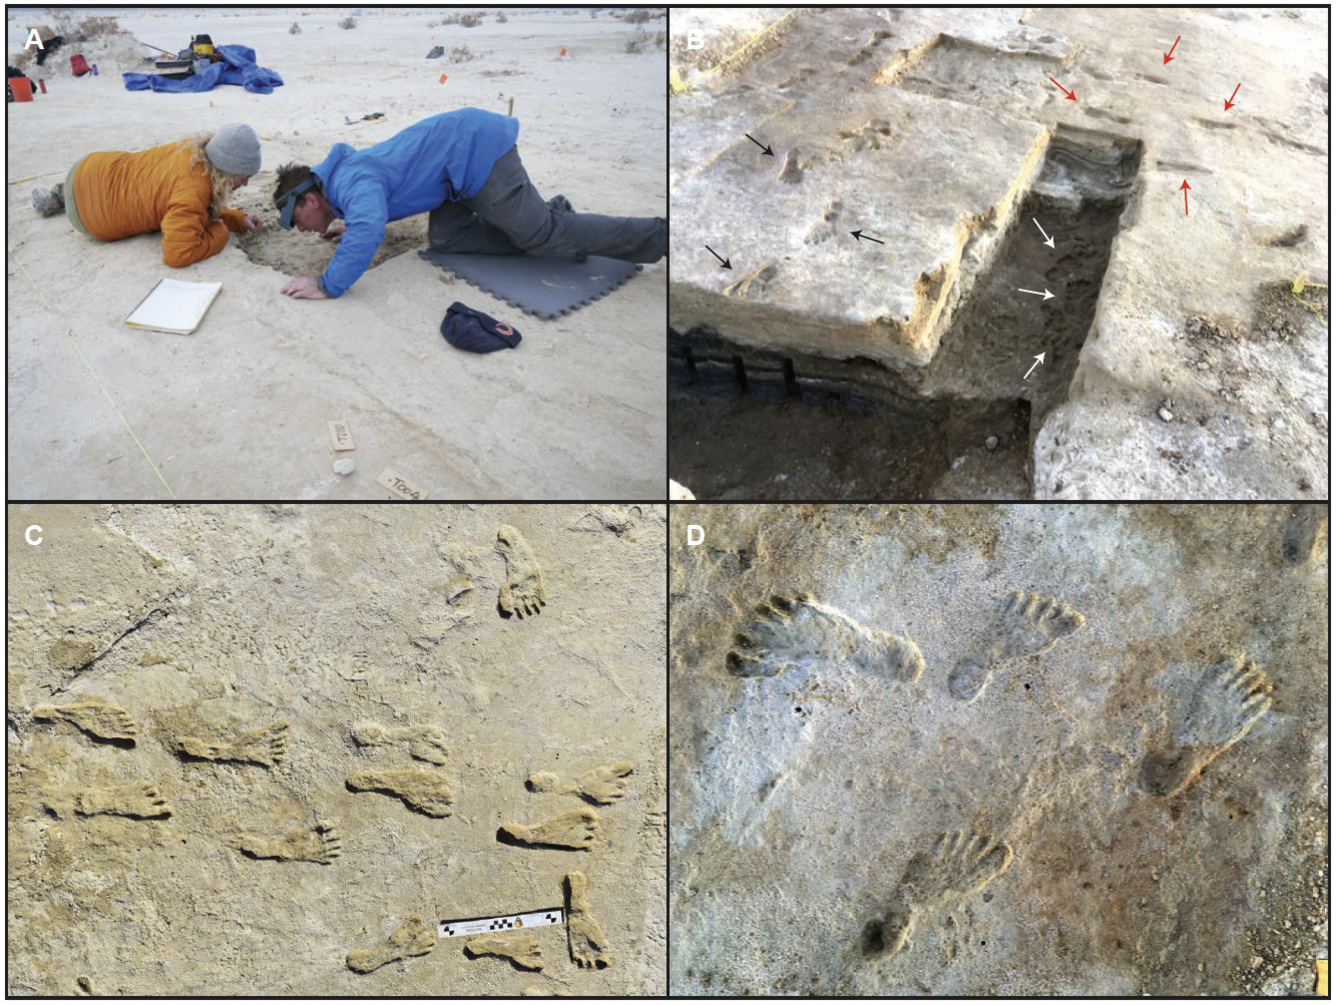
But it is not just human evolution studies that can benefit from the analysis of fossil footprints. A recent discovery of fossilized footprints has rewritten what we know about the peopling of the Americas. It was originally thought that humans had been in the Americas for at least the last 15,000 years by crossing through the ice-free corridor (IFC) between the Cordilleran and Laurentide ice sheets in present-day Alaska and Canada. However, fossil footprints from the Tularosa Basin of New Mexico (see Figure 7.18) discovered in 2021 have challenged this theory. The footprints, dated between 22,860 (∓320) and 21,130 (∓250) years ago (nps.gov) based on Ruppia cirrhosa grass seeds located above and below the footprints, have shown humans have been in the Americas for much longer than previously thought. These footprints represent an adolescent individual and toddler walking through the lakebed at White Sands (see Figure 7.19), New Mexico, alongside both giant ground sloths and mammoths (Barras 2022; Wade 2021). Also present in the lakebed are footprints of camels and dire wolves (nps.gov 2022; Wade 2021).
The IFC model was upheld by a group of theorists known as “Clovis First,” who believed the migration of people into the Americas was recent and was represented archaeologically through the Clovis projectile point toolkit. Subsequent discoveries at sites such as Cactus Hill on the east coast of the United States and Monte Verde, Chile, have demonstrated that this model wouldn’t have worked. Because these sites are as old as 20,000 years and 18,500 years respectively, the IFC would have been frozen over and impassable (Gruhn 2020). Other models have been adopted to account for this, such as the coastal migration model down the west coast of North America. The more-likely migration scenario seems to be neither of these as more discoveries or antiquity continue to emerge. People may instead have migrated into the Americas before the last glacial maximum began, around 25,500–19,000 years ago. According to Indigenous knowledge, they have always been here. With the discovery of the White Sands footprints, it is known that humans have been in the Americas for at least 20,000 years.
This discovery also reveals the importance of recognizing knowledge beyond that which is produced by the European scientific tradition. Rather than framing science in a way that runs counter to Indigenous knowledge, it can be thought that science is catching up with it. For instance, the Acoma Pueblo people have the word for camel in their vocabulary. This was dismissed by scientists who assumed the word was for describing camels that were introduced to the United States in the past 100 years. However, the discovery of the White Sands footprints also included the footprints of Pleistocene camels in the same strata. Therefore, the fact that the Acoma Pueblo people have had a word for camel likely refers the Pleistocene-age megafauna camel, Camelops hesternus, rather than Camelus dromedarius or Camelus bactrianus, two present-day camel species (which are actually descendants of Camelops hesternus). Therefore, the existence of the Acoma Pueblo word for camel is not like an anomaly but rather a testament to the fact that Acoma Pueblo ancestors walked beside C. hesternus on this continent 20,000 years ago. These footprints challenge the “ice-free corridor” expansion model, as the bridge connecting present-day Alaska and Russia into Canada would have been covered in an impenetrable ice sheet at this time. The discovery of these footprints urges scientists to reconsider further investigations at well-known Terminal Pleistocene/Early Holocene dry lake beds in the Southwestern and Mojave deserts—and to include Indigenous knowledge in their work rather than ignore it.
Special Topic: Necropolitics
What are necropolitics? Necropolitics is an application of critical theory that describes how “governments assign differential value to human life” and similarly how someone is treated after they die (Verghese 2021). How is someone’s death political?
Consider the La Brea Woman example from the section on asphalt above. The La Brea Woman’s discovery was controversial, not because she is the only person to be found in the tar pits or because of her age but also because of necropolitics. The La Brea Woman was collected in 1914 and her body was housed on display at the George C. Page Museum in Los Angeles against the wishes of the Chumash and the Tongva, two tribes whose ancestral lands include Los Angeles. The museum decided to display a skull cast instead to meet the request of the tribes which included a separate postcranial skeleton from a different individual. The updated display itself was wrought with other ethical issues, as a cast of her skull was “attached to the ancient remains of a Pakistani female that was dyed dark bronze, the femurs shortened to approximate the stature of native people” (Cooper 2010). In both cases, neither the individuals or their descendent communities consented to the display or grotesque modification of human remains. According to an interview conducted by LA Weekly (Cooper 2010) with Cindi Alvitre, former chair of the Gabrielino-Tongva Tribal Council, the display of Indigenous human remains is akin to voyeurism. She states “It’s disheartening to me because it’s very inappropriate to display any human remains. The things we do to fill the imagination of visitors. It violates human rights.” It is important to listen to the wishes of Indigenous people and center their values when conducting work with their ancestors. A good source for considering places to look for archaeological research ethics before conducting fieldwork (and ideally during your research design) is the Society for American Archaeology’s ethics principle list, as well as following the Indigenous Archaeology Collective.
Indigenous remains are now protected in the United States due to legislation such as Native American Graves Protection and Repatriation Act (NAGPRA). You can read more about this in Chapter 15: Bioarchaeology and Forensic Anthropology. Before the passing of NAGPRA, tribes had little agency over how the bodies of their ancestors were treated by anthropologists and museums, including decisions about sampling and destructive tests. Now when archaeological field work is conducted on federal land, tribes must be consulted before work begins. This consultation process often includes what to do if human remains are encountered. Indigenous tribes are multifaceted and multivocal; each has its own rules about how to handle the remains of their ancestors. In some cases, all work on the project must be halted after the discovery of human remains. Other tribes allow for work to continue if the remains are moved and reburied. Some tribes are open to radiometric dating if it aligns with their beliefs in the afterlife. Each tribe is different, and each tribe deserves to have its wishes respected.
Voices From the Past: What Fossils Can Tell Us
Given that so few organisms ever become fossilized, any anthropologist or fossil hunter will tell you that finding a fossil is extremely exciting. But this is just the beginning of a fantastic mystery. With the creative application of scientific methods and deductive reasoning, a great deal can be learned about the fossilized organism and the environment in which it lived, leading to enhanced understanding of the world around us.
Dating Methods
Context is a crucial concept in paleoanthropology and archaeology. Objects and fossils are interesting in and of themselves, but without context there is only so much we can learn from them. One of the most important contextual pieces is the dating of an object or fossil. By being able to place it in time, we can compare it more accurately with other contemporary fossils and artifacts or we can better analyze the evolution of a fossil species or artifacts. To answer the question “How do we know what we know?,” you have to know how archaeologists and paleoanthropologists establish dates for artifacts, fossils, and sites.
Though accurate dating is important for context and analysis, we must consider the impact. Many of the chronometric dating methods used by anthropologists require the removal of small samples from artifacts, bones, soils, and rock. Thus these techniques are considered destructive. How much of an artifact are you willing to destroy to get your date? Sharon Clough, a Senior Environmental Officer at Cotswold Archaeology, addressed this issue in a case study from her research. She stated that “the benefit of a date did not outweigh the destruction of a valuable and finite resource” (Clough 2020). The resource in question was human remains. When considering our dating options, we want to be sure that we do as little harm as possible, especially in the case of human remains (read more about this issue in the Special Topic box, “Necropolitics”).
Dating techniques are divided into two broad categories: relative dating methods and chronometric (sometimes called absolute) dating methods.
Relative Dating
Relative dating methods are used first because they rely on simple observational skills. In the 1820s, Christian Jürgensen Thomsen at the National Museum of Denmark in Copenhagen developed the “three-age” system still used in European archaeology today (Feder 2017, 17). He categorized the artifacts at the museum based on the idea that simpler tools and materials were most likely older than more complex tools and materials. Stone tools must predate metal tools because they do not require special technology to develop. Copper and bronze tools must predate iron because they can be smelted or worked at lower temperatures, etc. Based on these observations, he categorized the artifacts into Stone Age, Bronze Age, and Iron Age.
The restriction of relative dating is that you don’t know specific dates or how much time passed between different sites or artifacts. You simply know that one artifact or fossil is older than another. Thomsen knew that Stone Age artifacts were older than Bronze Age artifacts, but he couldn’t tell if they were hundreds of years older or thousands of years older. The same is true with fossils that have differences of ages into the hundreds of millions of years.
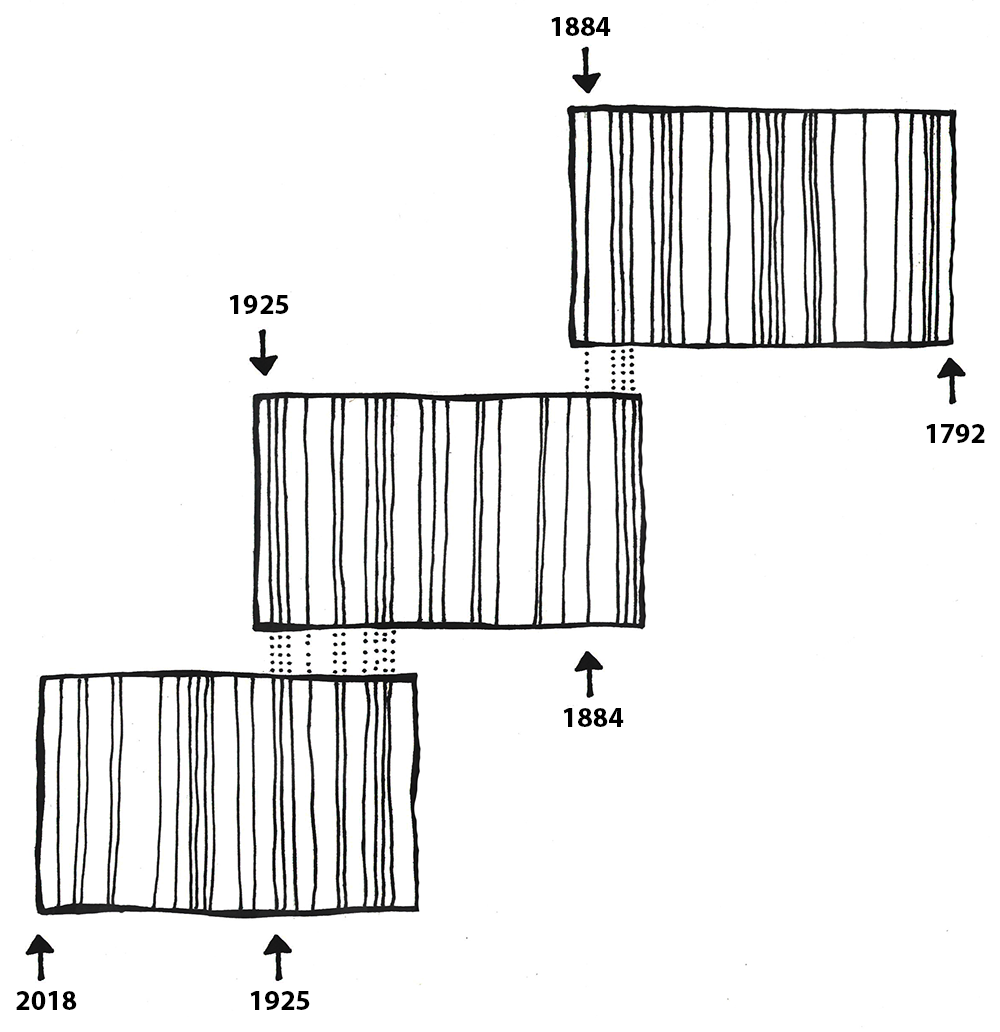
The first relative dating technique is stratigraphy (Figure 7.20). You might have already heard this term if you have watched documentaries on archaeological excavations. That’s because this method is still being used today. It provides a solid foundation for other dating techniques and gives important context to artifacts and fossils found at a site.
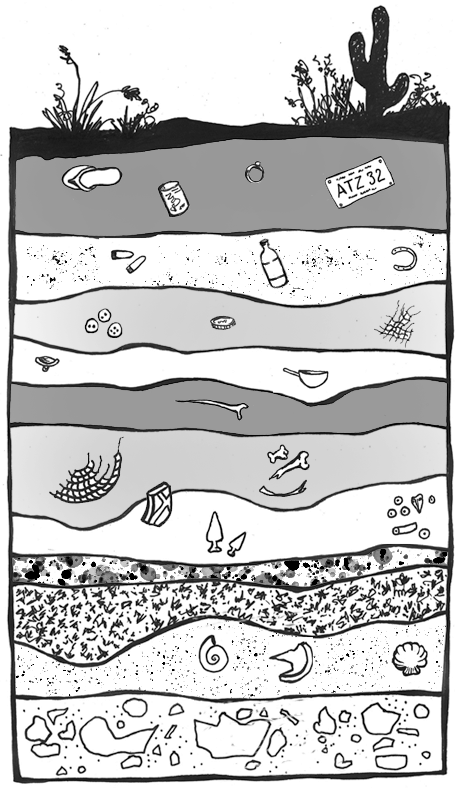
Stratigraphy is based on the Law of Superposition first proposed by Nicholas Steno in 1669 and further explored by James Hutton (the previously mentioned “Father” of Deep Time). Essentially, superposition tells us that things on the bottom are older than things on the top (Williams 2004, 28). Notice on Figure 7.20 that there are distinctive layers piled on top of each other. It stands to reason that each layer is older than the one immediately on top of it (Hester et al. 1997, 338). Think of a pile of laundry on the floor. Over the course of a week, as dirty clothes get tossed on that pile, the shirt tossed down on Monday will be at the bottom of the pile while the shirt tossed down on Friday will be at the top. Assuming that the laundry pile was undisturbed throughout the week, if the clothes were picked up layer by layer, the clothing choices that week could be reconstructed in the order that they were worn.
Another relative dating technique is biostratigraphy. This form of dating looks at the context of a fossil or artifact and compares it to the other fossils and biological remains (plant and animal) found in the same stratigraphic layers. For instance, if an artifact is found in the same layer as wooly mammoth remains, you know that it must date to around the last ice age, when wooly mammoths were still abundant on Earth. In the absence of more specific dating techniques, early archaeologists could prove the great antiquity of stone tools because of their association with extinct animals. The application of this relative dating technique in archaeology was used at the Folsom site in New Mexico. In 1927, a stone spear point was discovered embedded in the rib of an extinct species of bison. Because of the undeniable association between the artifact and the ancient animal, there was scientific evidence that people had occupied the North American continent since antiquity (Cook 1928).
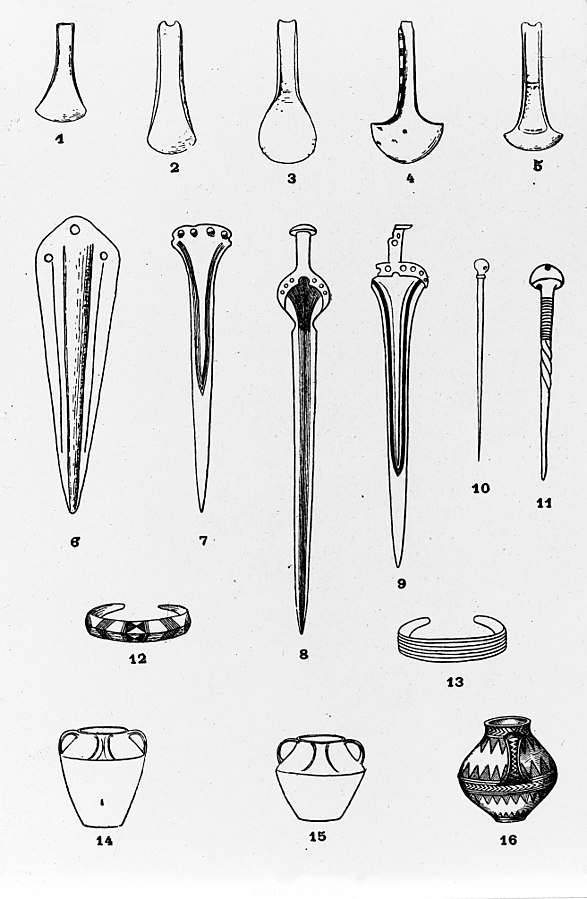
Similar to biostratigraphic dating is cultural dating (Figure 7.21). This relative dating technique is used to identify the chronological relationships between human-made artifacts. Cultural dating is based on artifact types and styles (Hester et al. 1997, 338). For instance, a pocket knife by itself is difficult to date. However, if the same pocket knife is discovered surrounded by cassette tapes and VHS tapes, it is logical to assume that the artifact came from the late 20th century like the cassette and VHS tapes. The pocket knife could not be dated earlier than the late 20th century because the tapes were made no earlier than 1977. In the Thomsen example above, he was able to identify a relative chronology of ancient European tools based on the artifact styles, manufacturing techniques, and raw materials. Cultural dating can be used with any human-made artifacts. Both cultural dating and biostratigraphy are most effective when researchers are already familiar with the time periods for the artifacts and animals. They are still used today to identify general time periods for sites.
Chemical dating was developed in the 19th century and represents one of the early attempts to use soil composition and chemistry to date artifacts. A specific type of chemical dating is fluorine dating, and it is commonly used to compare the age of the soil around bone, antler, and teeth located in close proximity (Cook and Ezra-Cohn 1959; Goodrum and Olson 2009). While this technique is based on chemical dating, it only provides the relative dates of items rather than their absolute ages. For this reason, fluorine dating is considered a hybrid form of relative and chronometric dating methods (which will be discussed next).
Soils contain different amounts of chemicals, and those chemicals, such as fluorine, can be absorbed by human and animal bones buried in the soil. The longer the remains are in the soil, the more fluorine they will absorb (Cook and Ezra-Cohn 1959; Goodrum and Olson 2009). A sample of the bone or antler can be processed and measured for its fluorine content. Unfortunately, this absorption rate is highly sensitive to temperature, soil pH, and varying fluorine levels in local soil and groundwater (Goodrum and Olson 2009; Haddy and Hanson 1982). This makes it difficult to get an accurate date for the remains or to compare remains between two sites. However, this technique is particularly useful for determining whether different artifacts come from the same burial context. If they were buried in the same soil for the same length of time, their fluorine signatures would match.
Chronometric Dating
Unlike relative dating methods, chronometric dating methods provide specific dates and time ranges. Many of the chronometric techniques we will discuss are based on work in other disciplines such as chemistry and physics. The modern developments in studying radioactive materials are accurate and precise in establishing dates for ancient sites and remains.
Many of the chronometric dating methods are based on the measurement of radioactive decay of particular elements. Elements are materials that cannot be broken down into more simple materials without losing their chemical identity (Brown et al. 2018, 48). Each element consists of an atom that has a specific number of protons (positively charged particles) and electrons (negatively charged particles) as well as varying numbers of neutrons (particles with no charge). The protons and neutrons are located in the densely compacted nucleus of the atom, but the majority of the volume of an atom is space outside the nucleus around which the electrons orbit (see Figure 7.22).

Elements are classified based on the number of protons in the nucleus. For example, carbon has six protons, giving it an atomic number 6. Uranium has 92 protons, which means that it has an atomic number 92. While the number of protons in the atom of an element do not vary, the number of neutrons may. Atoms of a given element that have different numbers of neutrons are known as isotopes.
The majority of an atom’s mass is determined by the protons and neutrons, which have more than a thousand times the mass of an electron. Due to the different numbers of neutrons in the nucleus, isotopes vary by nuclear/atomic weight (Brown et al. 2018, 94). For instance, isotopes of carbon include carbon 12 (12C), carbon 13 (13C), and carbon 14 (14C). Carbon always has six protons, but 12C has six neutrons whereas 14C has eight neutrons. Because 14C has more neutrons, it has a greater mass than 12C (Brown et al. 2018, 95).
Most isotopes in nature are considered stable isotopes and will remain in their normal structure indefinitely. However, some isotopes are considered unstable isotopes (sometimes called radioisotopes) because they spontaneously release energy and particles, transforming into stable isotopes (Brown et al. 2018, 946; Flowers et al. 2018, section 21.1). The process of transforming the atom by spontaneously releasing energy is called radioactive decay. This change occurs at a predictable rate for nearly all radioisotopes of elements, allowing scientists to use unstable isotopes to measure time passage from a few hundred to a few billion years with a large degree of accuracy and precision.
The leading chronometric method for archaeology is radiocarbon dating (Figure 7.23). This method is based on the decay of 14C, which is an unstable isotope of carbon. It is created when nitrogen 14 (14N) interacts with cosmic rays, which causes it to capture a neutron and convert to 14C. Carbon 14 in our atmosphere is absorbed by plants during photosynthesis, a process by which light energy is turned into chemical energy to sustain life in plants, algae, and some bacteria. Plants absorb carbon dioxide from the atmosphere and use the energy from light to convert it into sugar that fuels the plant (Campbell and Reece 2005, 181–200). Though 14C is an unstable isotope, plants can use it in the same way that they use the stable isotopes of carbon.
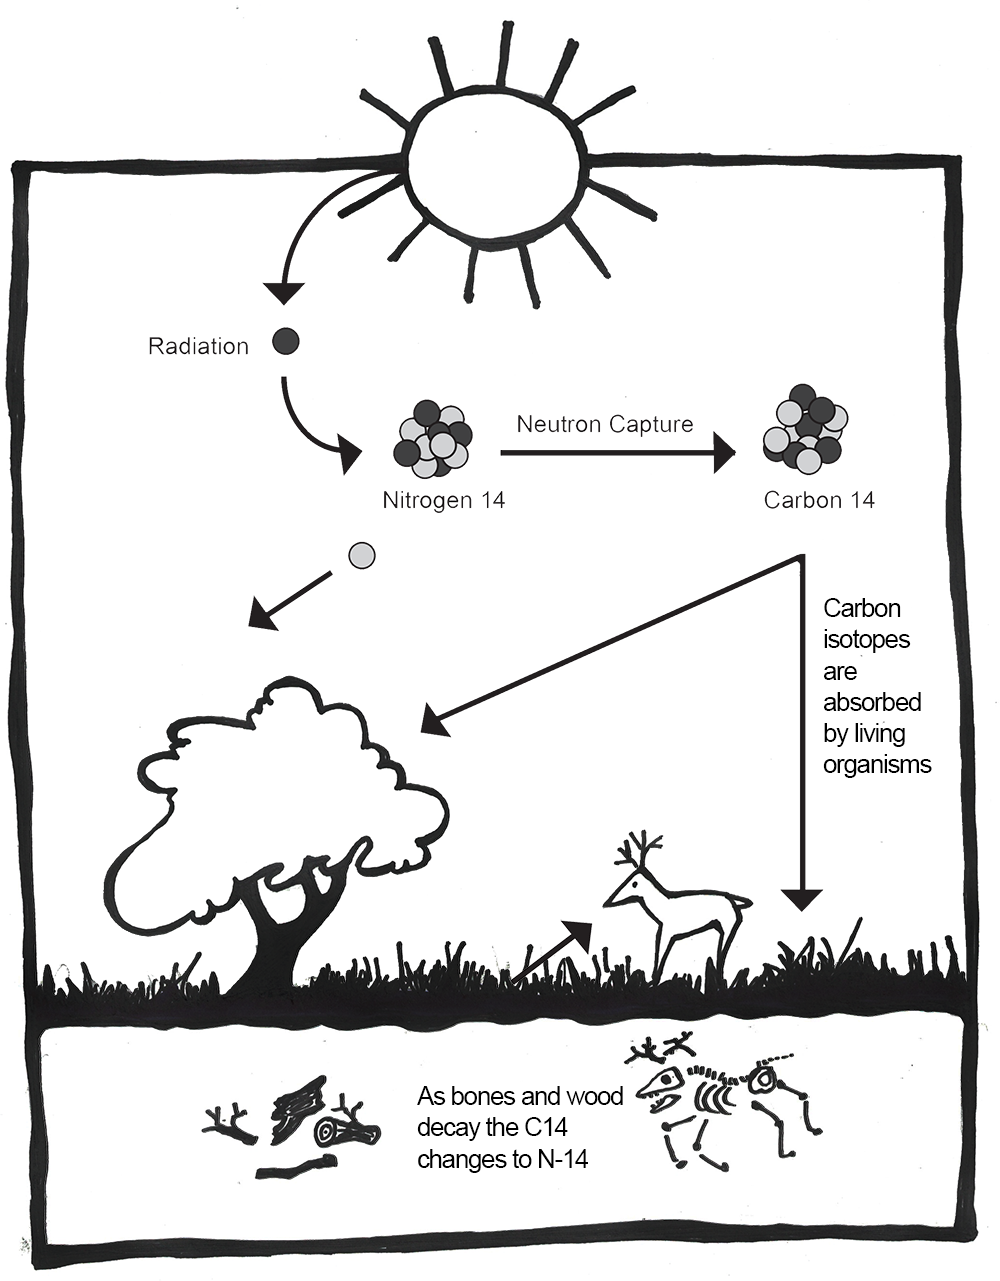
Animals get 14C by eating the plants. Humans take it in by eating plants and animals. After death, organisms stop taking in new carbon, and the unstable 14C will begin to decay. Carbon 14 has a half-life of 5,730 years (Hester et al. 1997, 324). That means that in 5,730 years, half the amount of 14C will convert back into 14N. Because the pattern of radioactive decay is so reliable, we can use 14C to accurately date sites up to 55,000 years old (Hajdas et al. 2021). However, 14C can only be used on the remains of biological organisms. This includes charcoal, shell, wood, plant material, and bone. This method involves destroying a small sample of the material. Earlier methods of radiocarbon dating required at least 1 gram of material, but with the introduction of accelerator mass spectrometry (AMS), sample sizes as small as 1 milligram can now be used (Hajdas et al. 2021). This significantly reduces the destructive nature of this method.
The use of radiocarbon dating at Denisova Cave in modern-day Russia revealed an astounding find, the first dated first-generation individual with a Neanderthal mother and Denisovan father. Vivian Slon and colleagues (2018) sequenced the genome, which revealed the individual’s hybrid genetic background, and radiocarbon dated the remains, revealing the sub-adult was over 50,000 years old (Slon et al. 2018).
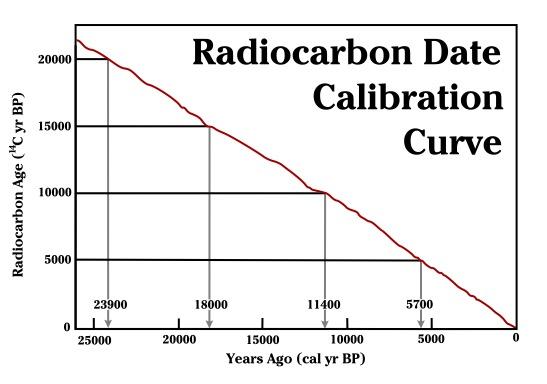
As mentioned before, 14C is unstable and ultimately decays back into 14N. This decay is happening at a constant rate (even now, inside your own body!). However, as long as an organism is alive and taking in food, 14C is being replenished in the body. As soon as an organism dies, it no longer takes in new 14C. We can then use the rate of decay to measure how long it has been since the organism died (Hester et al. 1997, 324). However, the amount of 14C in the atmosphere is not stable over time. It fluctuates based on changes to the earth’s magnetic field and solar activity. In order to turn 14C results into accurate calendar years, they must be calibrated using data from other sources. Annual tree rings (see discussion of dendrochronology below), foraminifera from stratified marine sediments, and microfossils from lake sediments can be used to chart the changes in 14C as “calibration curves.” The radiocarbon date obtained from the sample is compared to the established curve and then adjusted to reflect a more accurate calendar date (see Figure 7.24). The curves are updated over time with more data so that we can continue to refine radiocarbon dates (Törnqvist et al. 2016). The most recent calibration curves were released in 2020 and may change the dates for some existing sites by hundreds of years (Jones 2020).
As you will see in the hominin chapters (Chapters 9–12), 55,000 years is only a tiny fragment of human evolutionary history. It is insignificant in the context of the age of our planet. In order to date even older fossils, other methods are necessary.
Potassium-argon (K-Ar) dating and argon-argon (Ar-Ar) dating can reach further back into the past than radiocarbon dating. Used to date volcanic rock, these techniques are based on the decay of unstable potassium 40 (40K) into argon 40 (40Ar) gas, which gets trapped in the crystalline structures of volcanic material. It is a method of indirect dating. Instead of dating the fossil itself, K-Ar and Ar-Ar dates volcanic layers around the fossil. It will tell you when the volcanic eruption that deposited the layers occurred. This is where stratigraphy becomes important. The date of the surrounding layers can give you a minimum and maximum age of the fossil based on where it is in relation to those layers. This technique was used at Gesher Benot Ya’aqo in the Jordan Valley, dating early stratigraphic deposits of basalt flows to 100,000 years old (Bar-Yosef and Belmaker 2011). The site is unique because early layers of occupation with an Acheulean handaxe industry were made primarily of basalt, which is an uncommon material for this tool technology (see Chapter 10 for a full discussion of this tool technology). The benefit of this dating technique is that 40K has a half-life of circa 1.3 billion years, so it can be used on sites as young as 100 kya and as old as the age of Earth. As you will see in later chapters, it is particularly useful in dating early hominin sites in Africa (Michels 1972, 120; Renfrew and Bahn 2016, 155). Another benefit to this technique is that it does not damage precious fossils because the samples are taken from the surrounding rock instead. However, this method is not without its flaws. A study by J. G. Funkhouser and colleagues (1966) and Raymond Bradley (2015) demonstrated that igneous rocks with fluid inclusions, such as those found in Hawai‘i, can release gasses including radiogenic argon when crushed, leading to incorrectly older dates. This is an example of why it is important to use multiple dating methods in research to detect anomalies.
Uranium series dating is based on the decay chain of unstable isotopes of uranium. It uses mass spectrometry to detect the ratios of uranium 238 (238U), uranium 234(234U), and thorium 230 (230Th) in carbonates (Wendt et al. 2021). Thorium accumulates in the carbonate sample through radiometric decay. Thus, the age of the sample is calculated from the difference between a known initial ratio and the ratio present in the sample to be dated. This makes uranium series ideal for dating carbonate rich deposits such as carbonate cements from glacial moraine deposits, speleothems (deposits of secondary minerals that form on the walls, floors, and ceilings of caves, like stalactites and stalagmites), marine and lacustrine carbonates from corals, caliche, and tufa, as well as bones and teeth (University of Arizona, n.d.; van Calsteren and Thomas 2006). Due to the timing of the decay process, this dating technique can be used from a few years up to 650k (Wendt et al. 2021). Since many early hominin sites occur in cave environments, this dating technique can be very powerful. This method has also been used to develop more accurate calibration curves for radiocarbon dating. However, the accuracy of this method depends on knowing the initial ratios of the elements and ruling out possible contamination (Wendt et al. 2021). It also involves the destruction of a small sample of material.
Fission track dating is another useful dating technique for sites that are millions of years old. This is based on the decay of radioactive uranium 238 (238U). The unstable atom of 238U fissions at a predictable rate. The fission takes a lot of energy and causes damage to the surrounding rock. For instance, in volcanic glasses we can see this damage as trails in the glass. Researchers in the lab take a sample of the glass and count the number of fission trails using an optical microscope. As 238U has a half-life of 4,500 million years, it can be used to date rock and mineral material starting at just a few decades and extending back to the age of Earth. As with K-Ar, archaeologists are not dating artifacts directly. They are dating the layers around the artifacts in which they are interested (Laurenzi et al. 2007).
Luminescence dating, which includes thermoluminescence and a related technique called optically stimulated luminescence, is based on the naturally occurring background radiation in soils. Pottery, baked clay, and sediments that include quartz and feldspar are bombarded by radiation from the soils surrounding it. Electrons in the material get displaced from their orbit and trapped in the crystalline structure of the pottery, rock, or sediment. When a sample of the material is heated to 500°C (thermoluminescence) or exposed to particular light wavelengths (optically stimulated luminescence) in the laboratory, this energy gets released in the form of light and heat and can be measured (Cochrane et al. 2013; Renfrew and Bahn 2016, 160). You can use this method to date artifacts like pottery and burnt flint directly. When attempting to date fossils, you may use this method on the crystalline grains of quartz and feldspar in the surrounding soils (Cochrane et al. 2013). The important thing to remember with this form of dating is that heating the artifact or soils will reset the clock. The method is not necessarily dating when the object was last made or used but when it was last heated to 500°C or more (pottery) or exposed to sunlight (sediments). Luminescence dating can be used on sites from less than 100 years to over 100,000 years (Duller 2008, 4). As with all archaeological data, context is crucial to understanding the information.
Like thermoluminescence dating, electron spin resonance dating is based on the measurement of accumulated background radiation from the burial environment. It is used on artifacts and rocks with crystalline structures, including tooth enamel, shell, and rock—those for which thermoluminescence would not work. The radiation causes electrons to become dislodged from their normal orbit. They become trapped in the crystalline matrix and affect the electromagnetic energy of the object. This energy can be measured and used to estimate the length of time in the burial environment. This technique works well for remains as old as two million years (Carvajal et al. 2011, 115–116). It has the added benefit of being nondestructive, which is an important consideration when dealing with irreplaceable material.
Not all chronometric dating methods are based on unstable isotopes and their rates of decay. There are several other methods that make use of other natural biological and geologic processes. One such method is known as dendrochronology (Figure 7.25), which is based on the natural growth patterns of trees. Trees create concentric rings as they grow; the width of those rings depends on environmental conditions and season. The age of a tree can be determined by counting its rings, which also show records of rainfall, droughts, and forest fires.
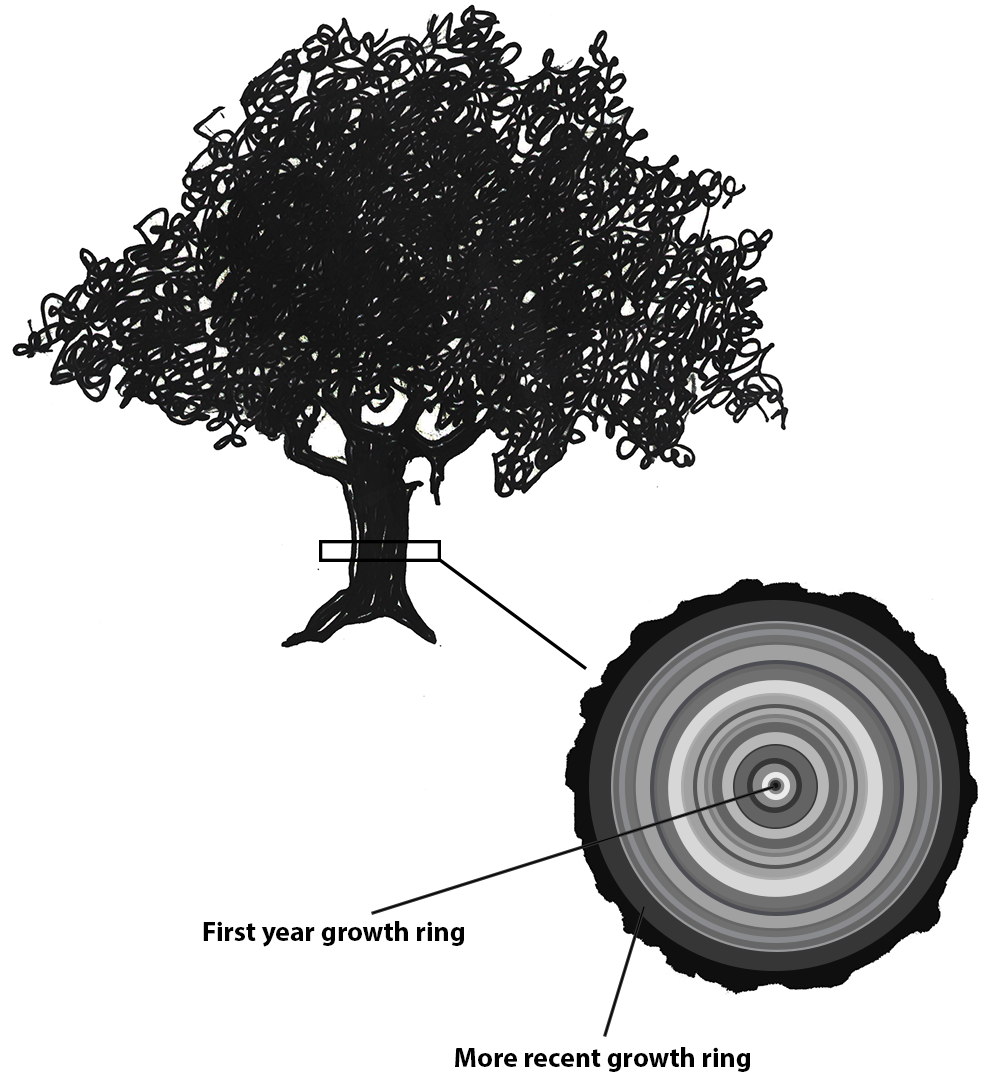
Tree rings can be used to date wood artifacts and ecofacts from archaeological sites. This first requires the creation of a profile of trees in a particular area. The Laboratory of Tree-Ring Research at the University of Arizona has a comprehensive and ongoing catalog of tree profiles (see University of Arizona n.d.). Archaeologists can then compare wood artifacts and ecofacts with existing timelines, provided the tree rings are visible, and find where their artifacts fit in the pattern. Dendrochronology has been in use since the early 20th century (Dean 2009, 25). The Northern Hemisphere chronology stretches back nearly 14,000 years (Reimer et al. 2013, 1870) and has been used successfully to date southwestern U.S. sites such as Pueblo Bonito and Aztec Ruin (Dean 2009, 26). Dendrochronological evidence has helped calibrate radiocarbon dates and even provided direct evidence of global warming (Dean 2009, 26–27).
In Australia, dendrochronology, along with other environmental reconstruction methods, has been used to show that the Indigenous people had sophisticated land management systems before the arrival of British invaders. According to the work of Michael-Shawn Fletcher and colleagues (2021), there was a significant encroachment of the rainforests and tree species into grasslands after the British invasion. Prior to this time, Indigenous people managed the landscape through controlled burns at regular intervals. This practice created climate-resistant grasslands that were biodiverse and provided predictable food supplies for humans and other animals. Under European land management, there have been negative impacts on biodiversity and climate resilience and an increase in catastrophic wildfires (Fletcher et al. 2021).
This dating method does have its difficulties. Some issues are interrupted ring growth, microclimates, and species growth variations. This is addressed through using multiple samples, statistical analysis, and calibration with other dating methods. Despite these limitations, dendrochronology can be a powerful tool in dating archaeological sites (Hillam et al. 1990; Kuniholm and Striker 1987).
Environmental Reconstruction
As you read in Chapter 2, Charles Darwin, Jean-Baptiste Lamarck, Alfred Russel Wallace, and others recognized the importance of the environment in shaping the evolutionary course of animal species. To understand what selective processes might be shaping evolutionary change, we must be able to reconstruct the environment in which the organism was living.
One of the ways to do that is to look at the plant species that lived in the same time range as the species in which you are interested. One way to identify ancient flora is to analyze sediment cores from water and other protected sources. Pollen gets released into the air and some of that pollen will fall on wetlands, lakes, caves, and so forth. Eventually it sinks to the bottom of the lake and forms part of the sediment. This happens year after year, so subsequent layers of pollen build up in an area, creating strata. By taking a core sample and analyzing the pollen and other organic material, an archaeologist can build a timeline of plant types and see changes in the vegetation of the area (Hester et al. 1997, 284). This can even be done over large areas by studying ocean bed cores, which accumulate pollen and dust from large swaths of neighboring continents.
While sediment coring is one of the more common ways to reconstruct past environments, there are a few other methods. These have been recently employed at Holocene Lake Ivanpah, a paleolake that straddles the California and Nevada border in the United States. This lake was originally thought to have been completely dry around 9,300–7,800 kya (Sims and Spaulding 2017). However, analyzing core samples using soil identification, sediment chemistry, subsurface stratigraphy, and geomorphology (the study of the physical characteristics of the Earth’s surface) revealed deposition of three recent lake fillings during this period in the forms of additional hardpan, or lake bottom, playas, bedded or layered fine-grained (wetland) sediments, and buried beaches below the surface (Sims and Spaulding 2017; Spaulding and Sims 2018). These discoveries are important because they have not been integrated into interpretation of the local archaeological record, as it was assumed that the lake had been dry for thousands of years. Sedimentological analyses such as coring and those listed above can provide great insight into past climates and are accomplished in a minimally destructive way.
Another way of reconstructing past environments is by using stable isotopes. Unlike unstable isotopes, stable isotopes remain constant in the environment throughout time. Plants take in the isotopes through photosynthesis and ground water absorption. Animals take in isotopes by drinking local water and eating plants. Stable isotopes can be powerful tools for identifying where an organism grew up and what kind of food the organism ate throughout its life. They can even be used to identify global temperature fluctuations.
Global Temperature Reconstruction
Oxygen isotopes are a powerful tool in tracking global temperature fluctuations throughout time. The isotopes of Oxygen 18 (18O) and Oxygen 16 (16O) occur naturally in Earth’s water. Both are stable isotopes, but 18O has a heavier atomic weight. In the normal water cycle, evaporation takes water molecules from the surface to the atmosphere. Because 16O is lighter, it is more likely to be part of this evaporation process. The moisture gathers in the atmosphere as clouds that eventually may produce rain or snow and release the water back to the surface of the planet. During cool periods like glacial periods (ice ages), the evaporated water often comes down to Earth’s surface as snow. The snow piles up in the winter but, because of the cooler summers, does not melt off. Instead, it gets compacted and layered year after year, eventually resulting in large glaciers or ice sheets covering parts of Earth. Since 16O, with the lighter atomic weight, is more likely to be absorbed in the evaporation process, it gets locked up in glacier formation. The waters left in oceans would have a higher ratio of 18O during these periods of cooler global temperatures (Potts 2012, 154–156; see Figure 7.26).

The microorganisms that live in the oceans, foraminifera, absorb the water from their environment and use the oxygen isotopes in their body structures. When these organisms die, they sink to the ocean floor, contributing to the layers of sediment. Scientists can extract these ocean cores and sample the remains of foraminifera for their 18O and 16O ratios. These ratios give us a good approximation of global temperatures deep into the past. Cooler temperatures indicate higher ratios of 18O (Potts 2012, 154–156).
Diet Reconstruction
You may be familiar with the saying “you are what you eat.” When it comes to your teeth and bones, this adage is literal. Stable isotopes can also be used to reconstruct animal diet and migration patterns. Living organisms absorb elements from ingested plants and water. These elements are used in tissues like bones, teeth, skin, hair, and so on. By analyzing the stable isotopes in the bones and teeth of humans and other animals, we can identify the types of food they ate at different stages of their lives.
Plants take in carbon dioxide from the atmosphere during photosynthesis. We’ve already discussed this using the example of the unstable isotope 14C; however, this absorption also takes place with the stable isotopes of 12C and 13C. During photosynthesis, some plants incorporate carbon dioxide as a three-carbon molecule (C3 plants) and some as a four-carbon molecule (C4 plants). On the one hand, C3 plants include certain types of trees and shrubs that are found in relatively wet environments and have lower ratios of 13C compared to 12C. C4 plants, on the other hand, include plants from drier environments like savannahs and grasslands. C4 plants have higher ratios of 13C to 12C than C3 plants (Renfrew and Bahn 2016, 312). These ratios remain stable as you go up the food chain. Therefore, you can analyze the bones and teeth of an animal to identify the 13C/12C ratios and identify the types of plants that animal was eating.
The ratios of stable nitrogen isotopes 15N and 14N can also give information about the diet of fossilized or deceased organisms. Though initially absorbed from water and soils by plants, the nitrogen ratios change depending on the primary diet of the organism. An animal who has a mostly vegetarian diet will have lower ratios of 15N to 14N, while those further up the food chain, like carnivores, will have higher ratios of 15N. Interestingly, breastfeeding infants have a higher nitrogen ratio than their mothers, because they are getting all of their nutrients through their mother’s milk. So nitrogen can be used to track life events like weaning (Jay et al. 2008, 2). A marine versus terrestrial diet will also affect the nitrogen signatures. Terrestrial diets have lower ratios of 15N than marine diets. In the course of human evolution, this type of analysis can help us identify important changes in human nutrition. It can help anthropologists figure out when meat became a primary part of the ancient human diet or when marine resources began to be used. The ratios of stable nitrogen isotopes can also be used to determine a change in status, as in the case of the Llullaillaco children (the “ice mummies”) found in the Andes Mountains. For instance, the nitrogen values in hair from the Llullaillaco Maiden showed a significant positive shift that is associated with increased meat consumption in the last 12 months of her life (Wilson et al. 2007). Although the two younger children had little changes in their diets in the last year of their short lives, the changes in their nitrogen values were significant enough to suggest that the improvement in their diets may have been attributed to the Incas’ desire to sacrifice healthy, high-status children” (Faux 2012, 6).
Migration
Stable isotopes can also tell us a great deal about where an individual lived and whether they migrated during their lifetime. The geology of Earth varies because rocks and soils have different amounts or ratios of certain elements in them. These variations in the ratios of isotopes of certain elements are called isotopic signatures. They are like a chemical fingerprint for a geographical region. These isotopes get into the groundwater and are absorbed by plants and animals living in that area. Elements like strontium, oxygen, and nitrogen, among others, are then used by the body to build bones and teeth. If you ate and drank local water all of your life, your bones and teeth would have the same isotopic signature as the geographical region in which you lived.
However, many people (and animals) move around during their lifetimes. Isotopic signatures can be used to identify migration patterns in organisms (Montgomery et al. 2005). Teeth develop in early childhood. If the isotopes of teeth are analyzed, these isotopes would resemble those found in the geographic area where an individual lived as a child. Bones, however, are a different story. Bones are constantly changing throughout life. Old cells are removed and new cells are deposited to respond to growth, healing, activity change, and general deterioration. Therefore, the isotopic signature of bones will reflect the geographical area in which an individual spent the last seven to ten years of life. If an individual has different isotopic signatures for their bones and teeth, it could indicate a migration some time during their life after childhood.
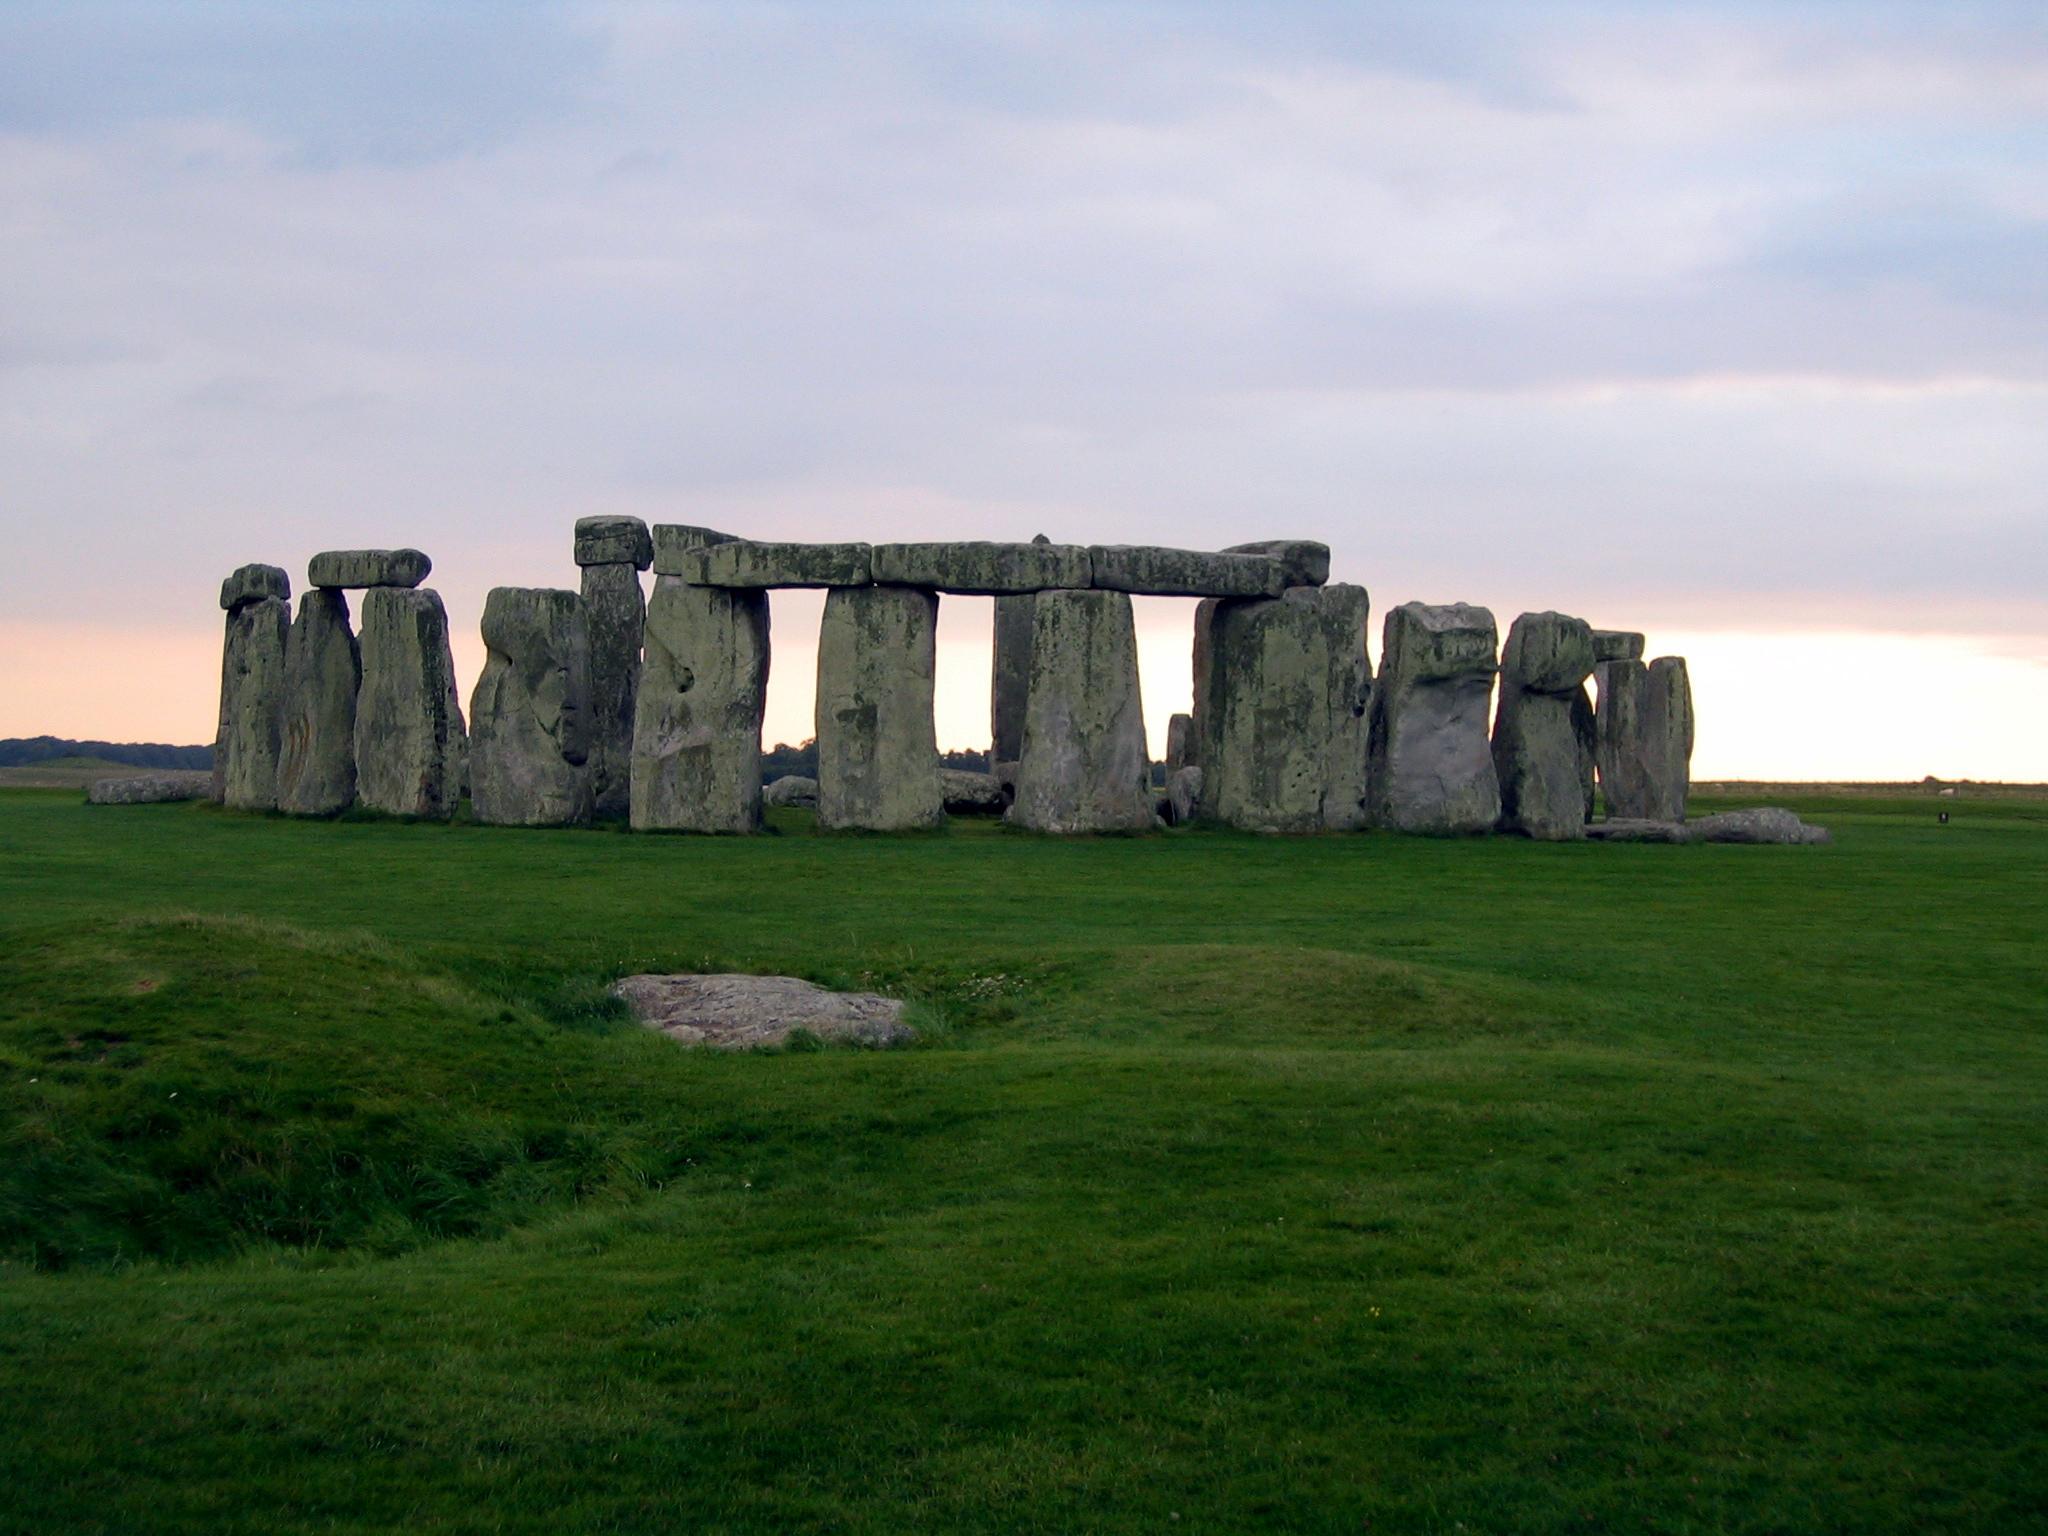
Recent work involving stable isotope analysis has been done on the cremation burials from Stonehenge, in Wessex, England (Figure 7.27). Much of the archaeological work at Stonehenge in the past focused on the building and development of the monument itself. That is partly because most of the burials at the monument were cremated remains, which are difficult to study because of their fragmentary nature and the chemical alterations that bone and teeth undergo when heated. The cremation process complicates the oxygen and carbon isotopes. However, the researchers determined that strontium would not be affected by heating and could still be analyzed in cranial fragments. Using the remains of 25 individuals, they compared their strontium signatures to the geology of Wessex and other regions of the UK. Fifteen of those individuals had strontium signatures that matched the local geology. This means that in the last ten or so years of their lives, they lived and ate food from around Stonehenge. However, ten of the individuals did not match the local geologic signature. These individuals had strontium ratios more closely aligned with the geology of west Wales. Archaeologists find this particularly interesting because in the early phases of Stonehenge’s construction, the smaller “blue stones” were brought 200 km from Wales in a feat of early engineering. These larger regional connections show that Stonehenge was not just a site of local importance. It dominated a much larger region of influence and drew people from all over ancient Britain (Snoeck et al. 2018).
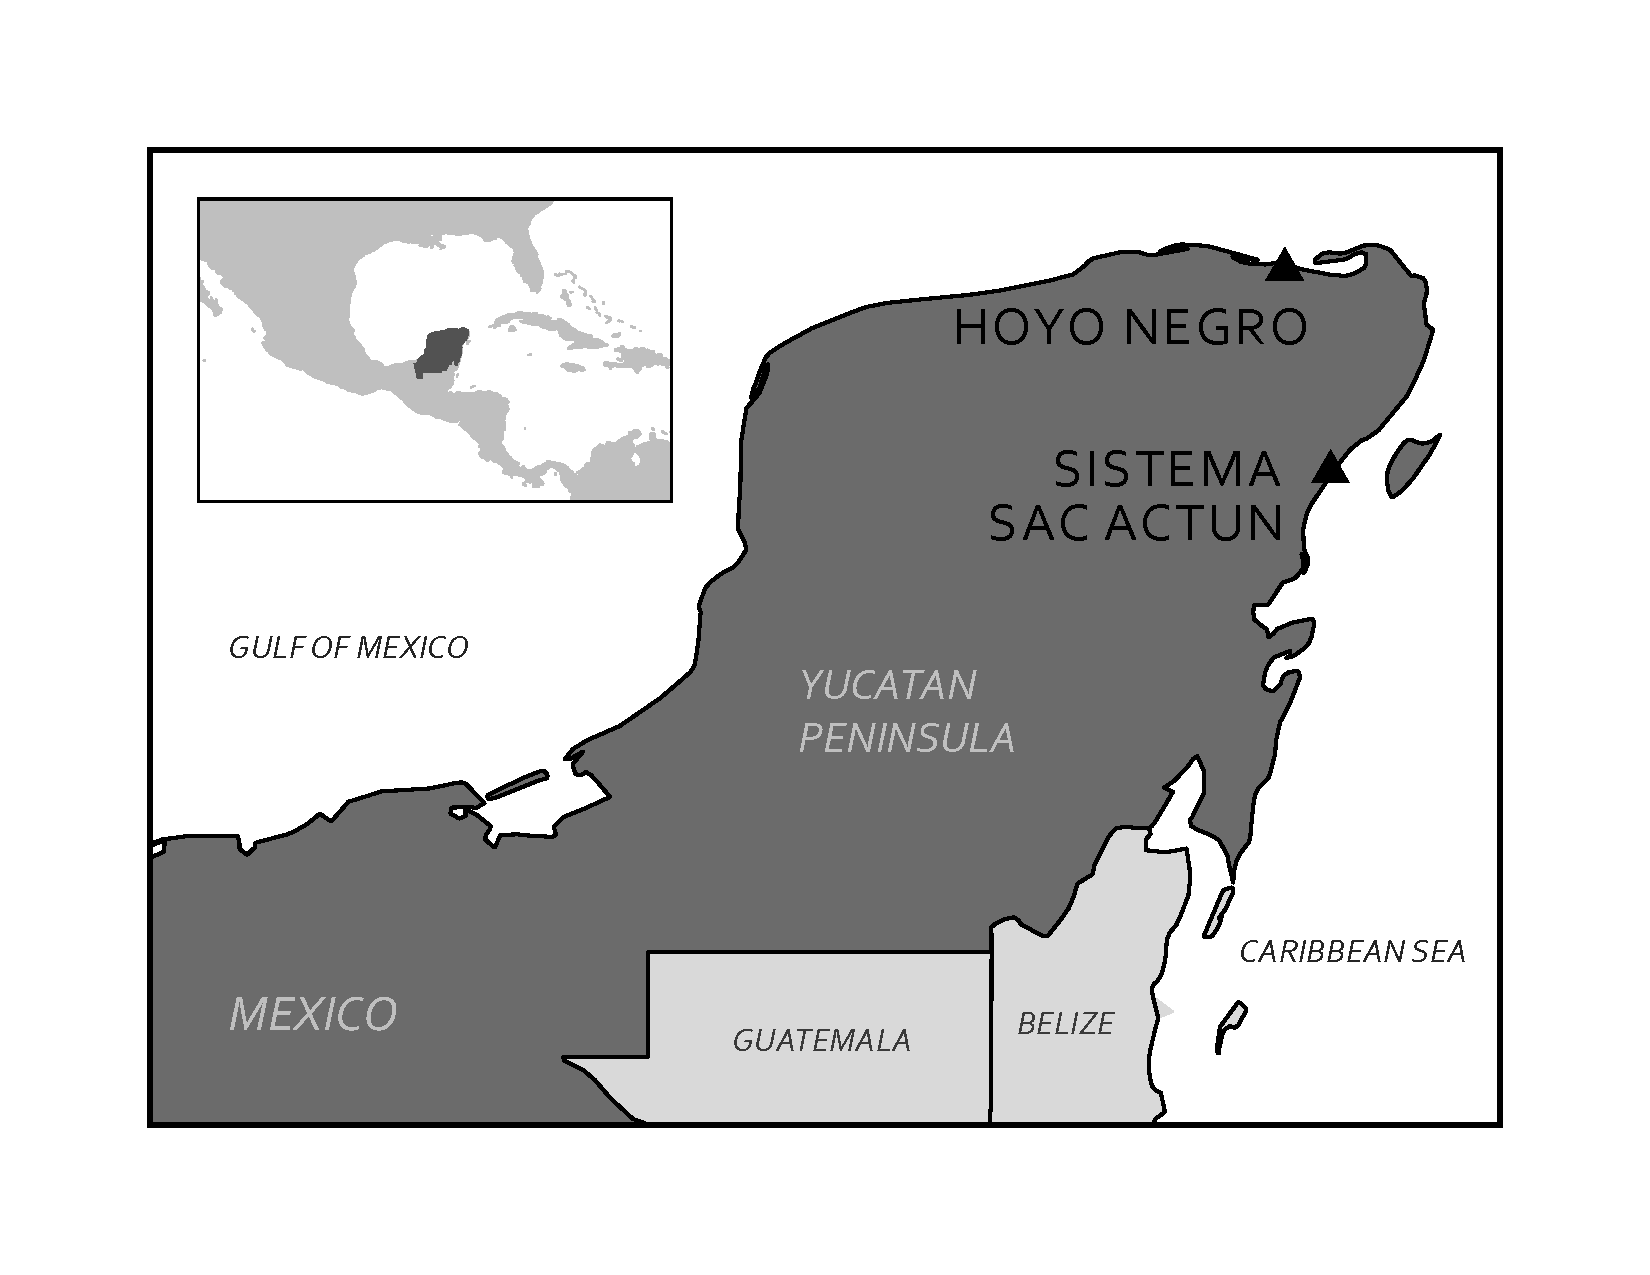
Special Topic: Cold Case Naia
In 2007, cave divers exploring the Sistema Sac Actun in the Yucatán Peninsula in Mexico (see Figure 7.28 and 7.29) discovered the bones of a 15- to 16-year-old female human along with the bones of various extinct animals from the Pleistocene (Collins et al. 2015). The site was named Hoyo Negro (“Black Hole”). The human bones belonged to a Paleo-American, later named “Naia” after a Greek water nymph. Examination of the partially fossilized remains revealed a great deal about Naia’s life, and the radiocarbon dating of her tooth enamel indicated that she lived some 13,000 years ago (Chatters et al. 2014). Naia’s arms were not overly developed, so her daily activities did not involve heavy carrying or grinding of grain or seeds. Her legs, however, were quite muscular, implying that Naia was used to walking long distances. Naia’s teeth and bones indicate habitually poor nutrition. There is evidence of violent injury during the course of Naia’s life from a healed spiral fracture of her left forearm. Naia also suffered from tooth decay and osteoporosis even though she appeared young and undersized. Dr. Jim Chatters hypothesizes that Naia entered the cave at a time when it was not flooded, probably looking for water. She may have become disoriented and fell off a high ledge to her death. The trauma to her pelvis is consistent with such an injury (Watson 2017).
Naia’s skeleton is remarkably complete given its age. As divers were able to locate her skull, Naia’s physical appearance in life could be interpreted. Surprisingly, in examining the skull, it was determined that Naia did not resemble modern Indigenous peoples in the region. However, the mitochondrial DNA (mtDNA) recovered from a tooth indicates that Naia shares her DNA with modern Indigenous peoples (Chatters et al. 2014). Though Naia’s burial environment made chemical analysis difficult, researchers were able to recover carbon isotopes from her remains. The isotopes from Naia’s tooth enamel suggest a diet of “cool-season grasses and/or broad-leaf vegetation” (Chatters et al. 2022, 68). Naia’s teeth also displayed numerous dental caries and only light dental wear. Coupled with the isotopic data, she likely had a “softer, more sugar-rich diet” (Chatters et al. 2022, 68).
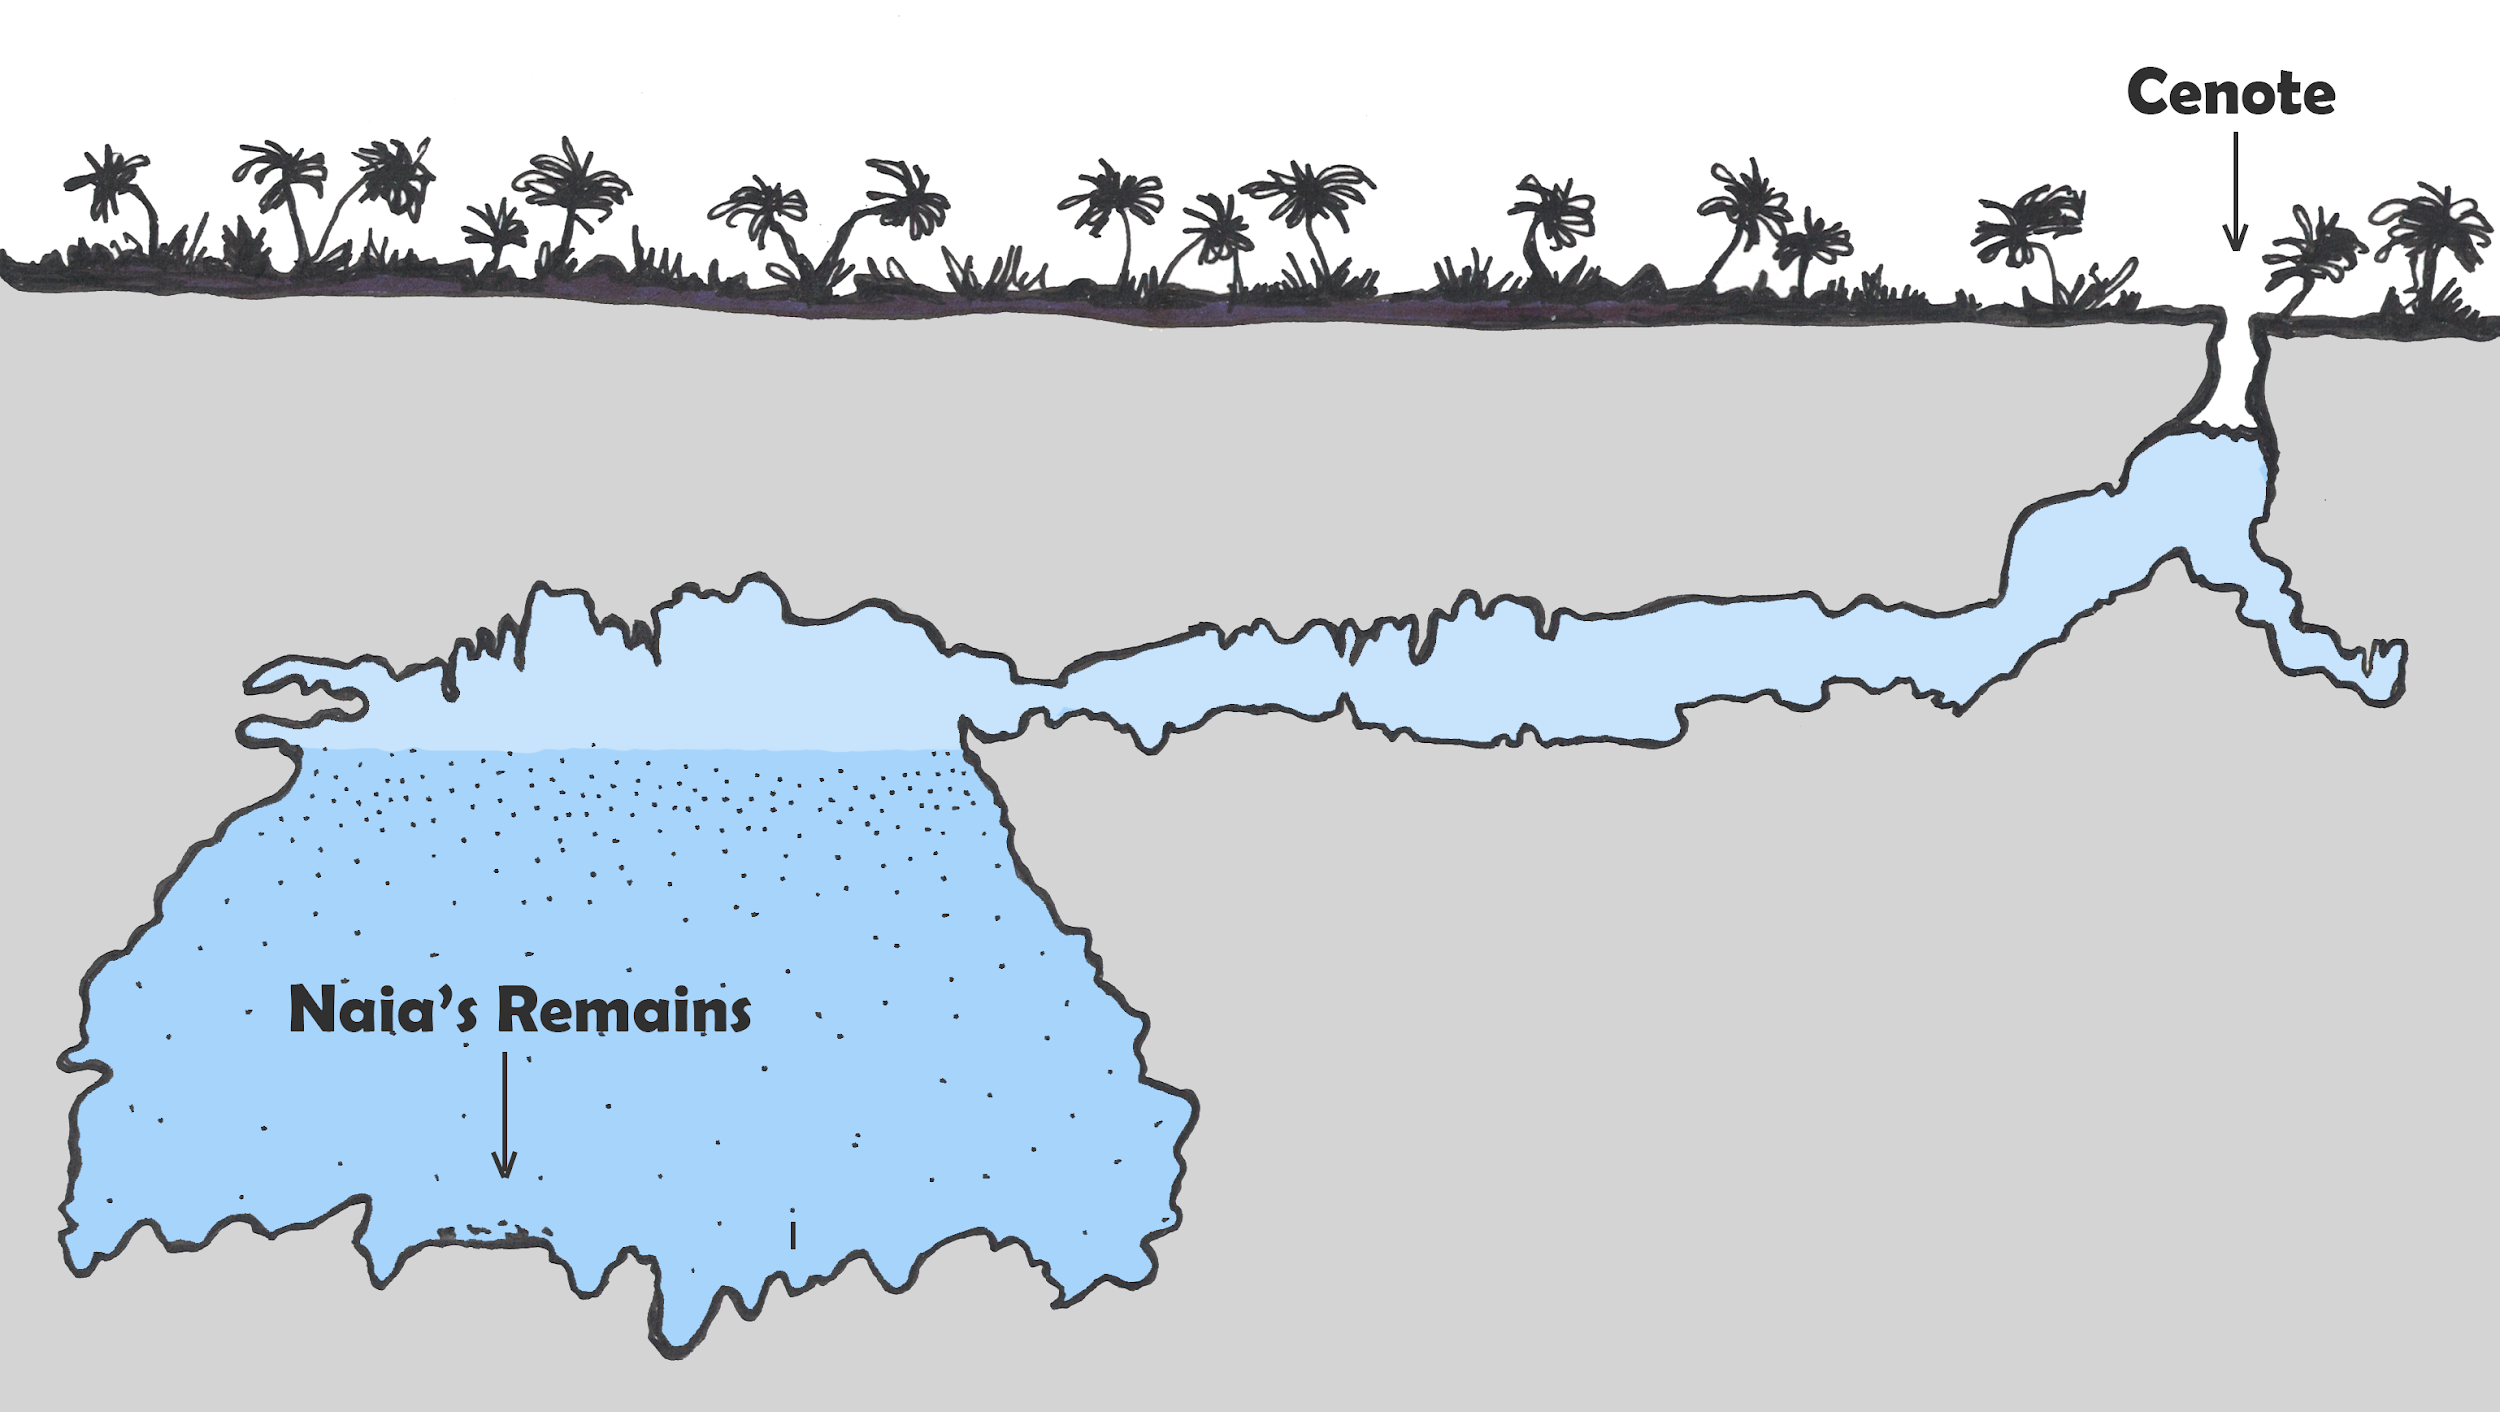
Summary
With a timeline that extends back some 4.6 billion years, Earth has witnessed continental drift, environmental changes, and a growing complexity of life. Fossils, the mineralized remains of living organisms, provide physical evidence of life and the environment on the planet over the course of billions of years. In order to better understand the fossil record, anthropologists rely on the collaboration of numerous academic fields and disciplines. Anthropologists use a variety of scientific methods, both relative and chronometric, to analyze fossils to determine age, origins, and migration patterns as well as to provide insight into the health and diet of the fossilized organism. While each method has its advantages, disadvantages, and limited applications, these tools enable anthropologists to theorize how all living organisms evolved, including the evolution of early humans into modern humans, H. sapiens. The fossil record is far from complete, but our expanding understanding of the fossil context, with exciting new discoveries and improved scientific methods, enables us to document the history of our planet and the evolution of life on Earth.
Dating Methods Quick Guide
|
Method |
Material |
Effective date range |
|---|---|---|
|
Stratigraphy |
Soil layers |
Relative |
|
Biostratigraphy |
Plant and animal remains |
Relative |
|
Cultural dating |
Human-made objects |
Relative |
|
Fluorine |
Bone, antler, teeth |
Relative |
|
Radiocarbon |
Organic carbon bearing material (bones, teeth, antler, plant material, shell, charcoal) |
Younger than 55,000 years |
|
Potassium-argon and argon-argon |
Volcanic rock |
Older than 100,000 years |
|
Uranium series |
Carbonates such as stalactites, stalagmites, corals, caliche, and tufa |
Younger than 650,000 years |
|
Fission track |
Volcanic glasses and crystalline minerals |
Spans age of Earth |
|
Luminescence |
Pottery, baked clay, sediments |
100 to older than 100,000 years |
|
Electron spin resonance dating |
Tooth enamel, shell, rock with crystalline structures |
Younger than 2 million years |
|
Dendrochronology |
Wood (where tree rings are identifiable) |
Dependent on location and available chronologies |
Review Questions
- How do remains become fossils? What conditions are necessary for the fossilization process?
- What kind of information could you acquire from a single fossil? What could it tell you about the broader environment?
- What factors would you take into consideration when deciding which dating method to use for a particular artifact?
- What methods do anthropologists use to reconstruct past environments and lifestyles?
Key Terms
Anaerobic: An oxygen-free environment.
Anthropocene: The proposed name for our current geologic epoch based on human-driven climate change.
Argon-argon (Ar-Ar) dating: A chronometric dating method that measures the ratio of argon gas in volcanic rock to estimate time elapsed since the volcanic rock cooled and solidified. See also potassium-argon dating.
Atom: A small building block of matter.
Bezoars: Hard, concrete-like substances found in the intestines of fossil creatures.
Biostratigraphy: A relative dating method that uses other plant and animal remains occurring in the stratigraphic context to establish time depth.
Bya: Billion years ago.
Chronometric dating: Dating methods that give estimated numbers of years for artifacts and sites.
Continental drift: The slow movement of continents over time.
Coprolite: Fossilized poop.
Cultural dating: The relative dating method that arranges human-made artifacts in a time frame from oldest to youngest based on material, production technique, style, and other features.
Deep Time: James Hutton’s theory that the world was much older than biblical explanations allowed. This age could be determined by gradual natural processes like soil erosion.
Dendrochronology: A chronometric dating method that uses the annual growth of trees to build a timeline into the past.
Electron spin resonance dating: A chronometric dating method that measures the background radiation accumulated in material over time.
Element: Matter that cannot be broken down into smaller matter.
Eon: The largest unit of geologic time, spanning billions of years and divided into subunits called eras, periods, and epochs.
Epochs: The smallest units of geologic time, spanning thousands to millions of years.
Eras: Units of geologic time that span millions to billions of years and that are subdivided into periods and epochs.
Fission track dating: A chronometric dating method that is based on the fission of 283U.
Fluorine dating: A relative dating method that analyzes the absorption of fluorine in bones from the surrounding soils.
Foraminifera: Single-celled marine organisms with shells.
Fossilization: The process by which an organism becomes a fossil.
Fossils: Mineralized copies of organisms or activity imprints.
Geomorphology: The study of the physical characteristics of the Earth’s surface.
Glacial periods: Periods characterized by low global temperatures and the expansion of ice sheets on Earth’s surface.
Holocene: The geologic epoch from 10 kya to present. (See the discussion on “the Anthropocene” for the debate regarding the current epoch name.)
Hominin: The term used for humans and their ancestors after the split with chimpanzees and bonobos.
In matrix: When a fossil is embedded in a substance, such as igneous rock.
Isotopes: Variants of elements.
Kya: Thousand years ago.
Law of Superposition: The scientific law that states that rock and soil are deposited in layers, with the youngest layers on top and the oldest layers on the bottom.
Lithification: The process by which the pressure of sediments squeeze extra water out of decaying remains and replace the voids that appear with minerals from the surrounding soil and groundwater.
Luminescence dating: The chronometric dating method based on the buildup of background radiation in pottery, clay, and soils.
Megafauna: Large animals such as mammoths and mastodons.
Mitochondrial DNA: DNA located in the mitochondria of a cell that is only passed down from biological mother to child.
Mya: Million years ago.
Paleopathology: Study of ancient diseases and injuries identified through examining remains.
Periods: Geologic time units that span millions of years and are subdivided into epochs.
Permineralization: When minerals from water impregnate or replace organic remains, leaving a fossilized copy of the organism.
Petrified wood: A fossilized piece of wood in which the original organism is completely replaced by minerals through petrifaction.
Potassium-argon (K-Ar) dating: A chronometric dating method that measures the ratio of argon gas in volcanic rock to estimate time elapsed since the volcanic rock cooled and solidified. See also argon-argon dating.
Pseudofossils: Natural rocks or mineral formations that can be mistaken for fossils.
Radioactive decay: The process of transforming the atom by spontaneously releasing energy.
Radiocarbon dating: The chronometric dating method based on the radioactive decay of 14C in organic remains.
Relative dating: Dating methods that do not result in numbers of years but, rather, in relative timelines wherein some organisms or artifacts are older or younger than others.
Sediment cores: Core samples taken from lake beds or other water sources for analysis of their pollen.
Stable isotopes: Variants of elements that do not change over time without outside interference.
Stratigraphy: A relative dating method that is based on ordered layers or (strata) that build up over time.
Taphonomy: The study of what happens to an organism after death.
Trace fossils: Fossilized remains of activity such as footprints.
Uniformitarianism: The theoretical perspective that the geologic processes observed today are the same as the processes operating in the past.
Unstable isotopes: Variants of elements that spontaneously change into stable isotopes over time.
Uranium series dating: A radiometric dating method based on the decay chain of unstable isotopes of 238U and 235U.
About the Authors
Sarah S. King, Ph.D.
Cerro Coso Community College, sarah.king1@cerrocoso.edu
Dr. Sarah S. King is an anthropology/sociology professor at Cerro Coso Community College in California. She completed her Ph.D. work at the Division of Archaeological, Geographical and Environmental Sciences at the University of Bradford in West Yorkshire, England. Her thesis was entitled “What Makes War?: Assessing Iron Age Warfare through Mortuary Behavior and Osteological Patterns of Violence.” She also holds anthropology degrees from the University of California, Santa Cruz (B.A. hons., 2004), and the University of New Mexico, Albuquerque (M.A., 2006).
 Kara Jones, M.A.
PhD student at University of Nevada, Las Vegas, jonesk44@unlv.nevada.edu
Kara Jones received their B.A. in anthropology at California State University, Bakersfield (2018) and their M.A. from University of Nevada, Las Vegas (2023, summer). Their master’s thesis is titled “Rockin’ at the Lake: Toolstone Use and Procurement along Holocene Lake Ivanpah, CA.” Mx Jones is a Mojave Desert archaeologist specializing in stone tool use and manufacture, focusing further on Holocene lakeshore adaptations.
For Further Exploration
Books
Bjornerud, Marcia. 2006. Reading the Rocks: The Autobiography of the Earth. New York: Basic Books.
Hazen, Robert M. 2013. The Story of Earth: The First 4.5 Billion Years, From Stardust to Living Planet. New York: Viking Penguin.
Holmes, Richard. 2010. The Age of Wonder: The Romantic Generation and the Discovery of the Beauty and Terror of Science. New York: Vintage.
Palmer, Douglas. 2005. Earth Time: Exploring the Deep Past from Victorian England to the Grand Canyon. New York: John Wiley & Sons.
Prothero, Donald R. 2015. The Story of Life in 25 Fossils: Tales of Intrepid Fossil Hunters and the Wonder of Evolution. New York: Columbia University Press.
Pyne, Lydia. 2016. Seven Skeletons: The Evolution of the World’s Most Famous Human Fossils. New York: Viking Books.
Repcheck, Jack. 2009. The Man Who Found Time: James Hutton and the Discovery of the Earth’s Antiquity. New York: Basic Books.
Taylor, Paul D., Aaron O’Dea. 2014. A History of Life in 100 Fossils. Washington, DC: Smithsonian Books.
Ward, David. 2002. Smithsonian Handbooks: Fossils. Washington, DC: Smithsonian Books.
Winchester, Simon. 2009. The Map That Changed the World: William Smith and the Birth of Modern Geology. New York: Harper Perennial.
Websites
East Tennessee State University Center of Excellence in Paleontology
Granger Historical Picture Archive
Indigenous Archaeology Collective
Natural History Museum (London), on Mary Anning
Petrified Forest National Park (NE Arizona)
Poozeum: The No. 2 Wonder of the World
Smithsonian National Museum of Natural History, Department of Paleobiology
Smithsonian National Museum of Natural History, on “What Does It Mean to be Human”
Society for American Archaeology, on “Ethics in Professional Archaeology”
Society for American Archaeology, “Principles of Archaeological Ethics”
References
Antoine, Pierre-Oliver, Maeva J. Orliac, Gokhan Atici, Inan Ulusoy, Erdal Sen, H. Evren Çubukçu, Ebru lbayrak, Neşe Oyal, Erkan Aydar, and Sevket Sen. 2012. “A Rhinocerotid Skull Cooked to Death in a 9.2 Mya-Old Ignimbrite Flow of Turkey.” PLoS ONE 7 (11): e49997.
Aufderheide, Arthur C. 2003. The Scientific Study of Mummies. Cambridge, UK: Cambridge University Press.
Bar-Yosef, O., and M. Belmaker. 2011. “Early and Middle Pleistocene Faunal and Hominins Dispersals through Southwestern Asia.” Quaternary Science Reviews 30 (11–12): 1318–1337.
Barras, C. 2022. “Lost Footprints of Our Ancestors.” New Scientist 254 (3381): 40–44.
Blong, John C., Martin E. Adams, Gabriel Sanchez, Dennis L. Jenkins, Ian D. Bull, and Lisa-Marie Shillito. 2020. “Younger Dryas and Early Holocene Subsistence in the Northern Great Basin: Multiproxy Analysis of Coprolites from the Paisley Caves, Oregon, USA.” Archaeological and Anthropological Sciences 12 (9): 1–29.
Boaz, Noel T., Russel L. Ciochon, Qinqi Xu, and Jinyi Liu. 2004. “Mapping and Taphonomic Analysis of the Homo erectus Loci at Locality 1 Zhoukoudian, China.” Journal of Human Evolution 46 (5): 519–549.
Booth, Thomas J., Andrew T. Chamberlain, and Mike Parker Pearson. 2015. “Mummification in Bronze Age Britain.” Antiquity 89 (347): 1,155–1,173.
Bradley, Raymond S. 2015. “Chapter 3: Dating Methods I.” In Paleoclimatology, edited by Raymond S. Bradley, 55–101. Cambridge, MA: Academic Press.
Brown, Theodore L., H. Eugene LeMay Jr., Bruce E. Burston, Catherine J. Murphy, Patrick M. Woodward, and Matthew Stoltzfus. 2018. Chemistry: The Central Science. New York: Pearson.
Campbell, Neil A., and Jane B. Reece. 2005. Biology 7th ed. New York: Pearson.
Carvajal, Eduar, Luis Montes, and Ovidio A. Almanza. 2011. “Quaternary Dating by Electron Spin Resonance (ESR) Applied to Human Tooth Enamel.” Earth Sciences Research Journal 15 (2): 115–120.
Chatters, James C., Joaquin Arroyo-Cabrales, and Pilar Luna-Erreguerena. 2022. “The Pre-Ceramic Skeletal Record of Mexico and Central America.” In The Routledge Handbook of Mesoamerican Bioarchaeology, edited by V. Tieslar, 49–74. New York: Routledge.
Chatters, James C., Douglas J. Kennett, Yemane Asmerom, Brian M. Kemp, Victor Polyak, Alberto Nava Blank, Patricia A. Beddows, et al. 2014. “Late Pleistocene Human Skeleton and mtDNA Link Paleoamericans and Modern Native Americans.” Science 344 (6185): 750–754.
Clough, Sharon. 2020. “Ethics in Human Osteology.” The Archaeologist 109 (2020): 3–5.
Cochrane, Grant W. G., Trudy Doelman, and Lyn Wadley. 2013. “Another Dating Revolution for Prehistoric Archaeology?” Journal of Archaeological Method and Theory 20 (1): 42–60.
Collins, S. V., E. G. Reinhardt, D. Rissolo, J. C. Chatters, A. Nava-Blank, and P. Luna-Erreguerena. 2015. “Reconstructing Water Level in Hoyo Negro, Quintana Roo, Mexico: Implications for Early Paleoamerican and Faunal Access.” Quaternary Science Reviews 124: 68–83.
Cook, Harold J. 1928. “Glacial Age Man in New Mexico.” Scientific American 139 (1): 38–40.
Cook, S. F., and H. C. Ezra-Cohn. 1959. “An Evaluation of the Fluorine Dating Method.” Southwestern Journal of Anthropology 15 (3): 276–290.
Cooper, Arnie. 2010. “Sticky Situation at the Tar Pits.” LA Weekly, May 27, 2010. https://www.laweekly.com/sticky-situation-at-the-tar-pits/.
Crompton, Robin H., Todd C. Pataky, Russell Savage, Kristiaan D’Août, Matthew R. Bennett, Michael H. Day, Karl Bates, Sarita Morse, and William I. Sellers. 2012. “Human-like External Function of the Foot, and Fully Upright Gait, Confirmed in the 3.66 Million Year Old Laetoli Hominin Footprints by Topographic Statistics, Experimental Footprint-Formation and Computer Simulation.” Journal of the Royal Society Interface 9 (69): 707–719. doi: 10.1098/rsif.2011.0258
Crutzen, Paul J., and Eugene F. Stoermer. 2000. “The ‘Anthropocene.’” Global Change Newsletter 41: 17–18.
Darwin, Charles. 1859. On the Origin of Species. London, UK: John Murray.
Dean, Jeffery S. 2009. “One Hundred Years of Dendroarchaeology: Dating, Human Behavior, and Past Climate.” In Tree-rings, Kings, and Old World Archaeology and Environment: Papers Presented in Honor of Peter Ian Kuniholm, edited by S. Manning and M. J. Bruce, 25–32. Oxford, UK: Oxbow Books.
Dolnick, Edward. 2011. The Clockwork Universe: Isaac Newton, the Royal Society, and the Birth of the Modern World. New York: HarperCollins.
Duller, G.A.T. 2008. Luminescence Dating: Guidelines on Using Luminescence Dating in Archaeology. Swindon, UK: English Heritage.
Eisenbeiss, Sabine. 2016. “Preserved in Peat: Decoding Bodies from Lower Saxony, Germany.” Expedition 58 (2): 18–21.
Emling, Shelley. 2009. The Fossil Hunter: Dinosaurs, Evolution, and the Woman Whose Discoveries Changed the World. New York: St. Martin’s Griffin.
Faux, Jennifer L. 2012. “Hail the Conquering Gods: Ritual Sacrifice of Children in Inca Society.” Journal of Contemporary Anthropology 3 (1): 1–15.
Feder, Kenneth L. 2017. The Past in Perspective: An Introduction to Human Prehistory. 7th ed. New York: Oxford University Press.
Fletcher, Michael-Shawn, Tegan Hall, and Andreas Nicholas Alexandra. 2021. “The Loss of an Indigenous Constructed Landscape Following British Invasion of Australia: An Insight into the Deep Human Imprint on the Australian Landscape.” Ambio 50 (1): 138–149.
Flowers, Paul, Klaus Theopold, Richard Langley, and William R. Robinson. 2018. Chemistry. Houston, TX: Openstax, Rice University.
Fumagalli, Matteo, Ida Moltke, Niels Grarup, Fernando Racimo, Peter Bjerregaard, Marit E. Jørgensen, Thorfinn S. Korneliussen, Pascale Gerbault, Line Skotte, Allan Linneberg, Cramer Christensen, Ivan Brandslund, Torben Jørgensen, Emilia Huerta-Sánchez, Erik B. Schmidt, Oluf Pedersen, Torben Hansen, Anders Albrechtsen, and Rasmus Nielsen. 2015. “Greenlandic Inuit show genetic signatures of diet and climate adaptation.” Science 349 (6254): 1343-1347.
Funkhouser, J. G., I. L. Barnes, and J. J. Naughton. 1966. ”Problems in the Dating of Volcanic Rocks by the Potassium-Argon Method.” Bull Volcanol 29: 709–717.
Giles, Melanie. 2020. Bog Bodies: Face to Face with the Past. Manchester, UK: Manchester University Press.
Goodrum, Matthew R., and Cora Olson. 2009. “The Quest for an Absolute Chronology in Human Prehistory: Anthropologists, Chemists, and the Fluorine Dating Method in Palaeoanthropology.” British Journal for the History of Science 42 (1): 95–114.
Granger, Darryl E., Ryan J. Gibbon, Kathleen Kuman, Ronald J. Clarke, Laurent Bruxelles, and Marc W. Caffee. 2015. “New Cosmogenic Burial Ages for Sterkfontein Member 2 Australopithecus and Member 5 Oldowan.” Nature 522 (7554): 85–88.
Granger Historical Picture Archive. 2018. Cro-Magnon Footprint. Image no. 0167868. Accessed March, 02, 2023. https://www.granger.com/results.asp?image=0167868&itemw=4&itemf=0001&itemstep=1&itemx=11&screenwidth=1085.
Gruhn, R., 2020. “Evidence Grows That Peopling of the Americas Began More Than 20,000 Years Ago.” Nature 584: 47–48.
Haddy, A., and A. Hanson. 1982. “Research Notes and Application Reports Nitrogen and Fluorine Dating of Moundville Skeletal Samples. Archaeometry 24 (1): 37–44.
Hajdas, I., P. Ascough, M. H. Garnett, S. J. Fallon, C. L. Pearson, G. Quarta, K. L. Spalding, H. Yamaguchi, and M. Yoneda. 2021. “Radiocarbon Dating.” Nature Reviews Methods Primers 1 (62): 1–26.
Hatala, Kevin G., Brigitte Demes, and Brian G. Richmond. 2016. “Laetoli Footprints Reveal Bipedal Gait Biomechanics Different from Those of Modern Humans and Chimpanzees.” Proceedings of the Royal Society B 283: 20160235. http://dx.doi.org/10.1098/rspb.2016.0235.
Hester, Thomas R., Harry J. Shafer, and Kenneth L. Feder. 1997. Field Methods in Archaeology, 7th ed. Mountain View, CA: Mayfield Publishing.
Hillam, J., C. M. Groves, D. M. Brown, M. G. L. Baillie, J. M. Coles, and B. J. Coles. 1990. “Dendrochronology of the English Neolithic.” Antiquity 64 (243): 210–220.
Holmes, Richard. 2010. The Age of Wonder: How the Romantic Generation Discovered the Beauty and Terror of Science. New York: Vintage.
Ingber, Sasha. 2012. “Volcano Eruption Baked Rare Rhino Fossil.” National Geographic News, November 30, 2012. Accessed July 25, 2018. https://www.nationalgeographic.com/science/article/121130-rare-rhino-fossil-created-by-volcanic-explosion.
Jay, Mandy, B. T. Fuller, Michael P. Richards, Christopher J. Knüsel, and Sarah S. King. 2008. “Iron Age Breastfeeding Practices in Britain: Isotopic Evidence from Wetwang Slack, East Yorkshire.” American Journal of Physical Anthropology 136 (3): 327–337.
Jones, Nicola. 2020. “Carbon Dating, the Archaeological Workhorse, Is Getting a Major Reboot.” Nature News, May 19, 2020. doi: https://doi.org/10.1038/d41586-020-01499-y
Klein, Richard G. 1999. The Human Career: Human Biological and Cultural Origins, 2nd ed. Chicago: University of Chicago Press.
Komar, Debra A., and Jane E. Buikstra. 2008. Forensic Anthropology: Contemporary Theory and Practice. New York: Oxford University Press.
Kuniholm, Peter Ian, and Cecil L. Striker. 1987. “Dendrochronological Investigations in the Aegean and Neighboring Regions, 1983–1986.” Journal of Field Archaeology 14 (4): 385–398.
Laurenzi, Marinella A., Maria Laura Balestrieri, Giulio Bigazzi, Julio C. Hadler Neto, Pedro J. Iunes, Pio Norelli, Massimo Oddone, Ana Maria Osorio Araya, and José G. Viramonte. 2007. “New Constraints on Ages of Glasses Proposed as Reference Materials for Fission-Track Dating.” Geostandards & Geoanalytical Research 31 (2): 105–124.
Lebatard, Anne-Elisabeth, Didier L. Bourlès, Philippe Duringer, Marc Jolivet, Régis Braucher, Julien Carcaillet, Mathieu Schuster, et al. 2008. “Cosmogenic Nuclide Dating of Sahelanthropus tchadensis and Australopithecus bahrelghazali: Mio-Pliocene Hominids from Chad.” Proceedings of the National Academy of Sciences 105 (9): 3226–3231.
Lyell, Charles. 1830–1833. Principles of Geology, Being an Attempt to Explain the Former Changes of the Earth’s Surface, by Reference to Causes Now in Operation. 3 vols. London: John Murray.
Maixner, Frank, Dmitrij Turaev, Amaury Cazenave-Gassiot, Marek Janko, Ben Krause-Kyora, Michael R. Hoopmann, Ulrike Kusebauch, et al. 2018. “The Iceman’s Last Meal Consisted of Fat, Wild Meat, and Cereals.” Current Biology Report 28 (14): 2348–2355.
Masao, Fidelis T., Elgidius B. Ichumbaki, Marco Cherin, Angelo Barili, Giovanni Boschian, David A. Lurino, Sofia Menconero, Jacopo Moggi-Cecchi, and Giorgio Manzi. 2016. “New Footprints from Laetoli (Tanzania) Provide Evidence for Marked Body Size Variation in Early Hominins.” eLife 5: e19568. https://elifesciences.org/articles/19568.
McDonough, Katelyn, Taryn Johnson, Ted Goebel, and Karl Reinhard. 2022. “Disease, Diet, and Thorny Headed Worm Infection in the Great Basin.” Paper presented at 50th Annual Meeting of the Nevada Archaeological Association, Tonopah, Nevada, April 22nd, 2022.
Michels, Joseph W. 1972. “Dating Methods.” Annual Review of Anthropology 1: 113–126.
Monastersky, Richard. 2015. “Anthropocene: The Human Age.” Nature 519 (7542): 144–147.
Montgomery, Janet, Jane A. Evans, Dominic Powlesland, and Charlotte A. Roberts. 2005. “Continuity or Colonization in Anglo-Saxon England? Isotope Evidence for Mobility, Subsistence Practice, and Status at West Heslerton.” American Journal of Physical Anthropology 126 (2): 123–138.
National Park Service. 2022. “Fossilized Footprints.” National Park Service website, February 1. Accessed May 31, 2022. https://www.nps.gov/whsa/learn/nature/fossilized-footprints.htm.
Pastoors, Andreas, Tilman Lenssen-Erz, Bernd Breuckmann, Tsamkxao Ciqae, Ui Kxunta, Dirk Rieke-Zapp, and Thui Thao. 2017. “Experience Based Reading of Pleistocene Human Footprints in Pech-Merle.” Quaternary International 430 (A): 155–162.
Potts, Richard. 2012. “Evolution and Environmental Change in Early Human Prehistory.” Annual Review of Anthropology 41: 151–167.
Raichlen, David A., and Adam D. Gordon. 2017. “Interpretation of Footprints From Site S Confirms Human-like Bipedal Biomechanics in Laetoli Hominins.” Journal of Human Evolution 107: 134–138.
Ravn, Morten. 2010. “Bronze and Early Iron Age Bog Bodies from Denmark.” Acta Archaeologica 81 (1): 112–113.
Reimer, Paula J., Edouard Bard, Alex Bayliss, J. Warren Beck, Paul G. Blackwell, Christopher Bronk Ramsey, Caitlin E. Buck, et al. 2013. “INTCAL13 and Marine13 Radiocarbon Age Calibration Curves 0–50,000 Years cal BP.” Radiocarbon 55 (4): 1869–1887.
Reinhard, Johan. 2006. Ice Maiden: Inca Mummies, Mountain Gods, and Sacred Sites in the Andes. Washington, DC.: National Geographic.
Reitz, Elizabeth J., and Elizabeth S. Wing. 1999. Zooarchaeology. Cambridge, UK: Cambridge University Press.
Renfrew, Colin, and Paul Bahn. 2016. Archaeology: Theories, Methods, and Practice, 7th ed. New York: Thames and Hudson.
Ruddiman, William F., Zhengtang Guo, Xin Zhou, Hanbin Wu, and Yanyan Yu. 2008. “Early Rice Farming and Anomalous Methane Trends.” Quaternary Science Reviews 27 (13–14): 1291–1295.
Schmidt, Gavin. 1999. “Science Briefs: Cold Climates, Warm Climates: How Can We Tell Past Temperatures?” National Aeronautics and Space Administration Goddard Institute for Space Studies. https://www.giss.nasa.gov/research/briefs/1999_schmidt_01/
Shillito, Lisa-Marie, John C. Blong, Eleanor J. Green, and Eline N. van Asperen. 2020a. “The What, How and Why of Archaeological Coprolite Analysis.” Earth-Science Reviews 207. https://doi.org/10.1016/j.earscirev.2020.103196.
Shillito, Lisa-Marie, Helen L. Whelton, John C. Blong, Dennis L. Jenkins, Thomas J. Connolly, and Ian D. Bull. 2020b. “Pre-Clovis occupation of the Americas Identified by Human Fecal Biomarkers in Coprolites from Paisley Caves, Oregon.” Science Advances 6 (29). https://www.science.org/doi/10.1126/sciadv.aba6404.
Sims, Douglas., and W. Spaulding. 2017. “Shallow Subsurface Evidence for Postglacial Holocene Lakes at Ivanpah Dry Lake: An Alternative Energy Development Site in the Central Mojave Desert, California, USA.” Journal of Geography and Geology 9 (1): 1–24. DOI: 10.5539/jgg.v9n1p1.
Slon, Viviane, Fabrizio Mafessoni, Benjamin Vernot, Cesare De Filippo, Steffi Grote, Bence Viola, Mateja Hajdinjak, Stéphane Peyrégne, Sarah Nagel, Samantha Brown, et al. 2018. “The Genome of the Offspring of a Neanderthal Mother and a Denisovan Father.” Nature 561 (7721): 113–116.
Smithsonian National Museum of Natural History. 2018. Laetoli Footprint Trails. Smithsonian National Museum of History, October 23. Accessed February 14, 2023. http://humanorigins.si.edu/evidence/behavior/footprints/laetoli-footprint-trails.
Snoeck, Christophe, John Pouncett, Philippe Claeys, Steven Goderis, Nadine Mattielli, Mike Parker Pearson, Christie Willis, Antoine Zazzo, Julia A. Lee-Thorp, and Rick J. Schulting. 2018. “Strontium Isotope Analysis on Cremated Human Remains from Stonehenge Support[sic] Links With West Wales.” Scientific Reports 8. https://www.nature.com/articles/s41598-018-28969-8.
Spaulding, W. G., and D. B. Sims. 2018. “A Glance to the East: Lake Ivanpah—An Isolated Southern Great Basin Paleolake. The 2018 Desert Symposium Field Guide and Proceedings, 121-131. https://www.researchgate.net/publication/340493333_A_glance_to_the_east_Lake_Ivanpah-_an_isolated_southern_Great_Basin_paleolake
Spray, Aaron. “La Brea Woman: Only (& Controversial) Human from La Brea Tar Pits.” The Travel, April 3, 2022. Accessed July 31, 2022. https://www.thetravel.com/what-to-know-of-the-la-brea-woman/.
Steffen, Will, Johan Rockström, Katherine Richardson, Timothy M. Lenton, Carl Folke, Diana Liverman, Colin P. Summerhayes, et al. 2018. “Trajectories of the Earth System in the Anthropocene.” PNAS 115 (33): 8252–8259.
Stodder, Ann L. W. 2008. “Taphonomy and the Nature of Archaeological Assemblages.” In Biological Anthropology of the Human Skeleton, edited by M. Anne Katzenberg and Shelley R. Saunders, 71–115. Hoboken, NJ: Wiley Blackwell.
Straus, Lawrence Guy. 1989. “Grave Reservations: More on Paleolithic Burial Evidence.” Current Anthropology 30 (5): 633–634.
Sullivan, Terry, and Harry Gifford. 1908. She Sells Sea-Shells. London: Francis, Day, and Hunter.
Taylor, Anthony, Jarod M. Hutson, Vaughn M. Bryant, and Dennis L. Jenkins. 2020. “Dietary Items in Early to Late Holocene Human Coprolites from Paisley Caves, Oregon, USA.” Palynology 44 (1): 12–23.
Taylor, Paul D., Aaron O’Dea. 2014. A History of Life in 100 Fossils. Washington, D.C.: Smithsonian Books.
Törnqvist, T. E., B. E. Rosenheim, P. Hu, and A. B. Fernandez. 2015. “Radiocarbon Dating and Calibration.” In Handbook of Sea-Level Research, edited by Ian Shennan, Antony J. Long, and Benjamin P. Horton, 347-360. Oxford, UK: John Wiley & Sons. https://doi.org/10.1002/9781118452547.ch23
University of Arizona. n.d. “Uranium-Thorium Dating: The Uranium 238 Decay Series.” Accessed November 21, 2022. https://www.geo.arizona.edu/Antevs/ecol438/uthdating.html
University of the Witwatersrand. 2017. “Little Foot Takes a Bow: South Africa’s Oldest and the World’s Most Complete Australopithecus Skeleton Ever Found, Introduced to the World.” ScienceDaily, December 6. Accessed February 14, 2023. https://www.sciencedaily.com/releases/2017/12/171206100104.htm.
van Calsteren, Peter, and Louise Thomas. 2006. “Uranium-Series Dating Applications in Natural Environmental Science.” Earth-Science Reviews 75 (1–4): 155–175.
Vanzetti, A., M. Vidale, M. Gallinaro, D. W. Frayer, and L. Bondioli. 2010. “The Iceman as a Burial.” Antiquity 84 (325): 681–692. https://doi.org/10.1017/S0003598X0010016X.
Verghese, Namrata. 2021. “What Is Necropolitics? The Political Calculation of Life and Death.” Teen Vogue. March 10, 2021. Accessed February 14, 2023. https://www.teenvogue.com/story/what-is-necropolitics.
Vidale, M., L. Bondioli, D. W. Frayer, M. Gallinaro, and A. Vanzetti. 2016. “Ötzi the Iceman.” Expedition 58 (2): 13–17. Accessed February 14, 2023. https://www.penn.museum/sites/expedition/otzi-the-iceman/.
Wade, Lizzie. 2021. “Footprints Support Claim of Early Arrival in the Americas.” Science 373 (6562): 1426. Accessed February 14, 2023. https://www.sciencemagazinedigital.org/sciencemagazine/24_september_2021/MobilePagedArticle.action?articleId=1727132#articleId1727132.
Waters, Colin N., Jan Zalasiewicz, Anthony D. Barnosky, Alejandro Cearreta, Agieszka Galuszka, Juliana A. Ivar Do Sul, Catherine Jeandel, et al. 2016 “Is the Anthropocene Distinct from the Holocene?” Science 351 (6269): aad2622-1-10. DOI:10.1126/science.aad2622
Watson, Traci. 2017. “Ancient Bones Reveal Girl’s Tough Life in Early Americas.” Nature 544 (7648): 15–16.
Wendt, Kathleen, A., Xianglei Li,, and R. Lawrence Edwards. 2021. “Uranium-Thorium Dating of Speleothems.” Elements 17 (2): 87–92.
White, Tim D. 1986. “Cut Marks on the Bodo Cranium: A Case of Prehistoric Defleshing.” American Journal of Physical Anthropology 69 (4): 503–509.
Williams, Linda D. 2004. Earth Science Demystified. New York: McGraw-Hill Professional.
Wilson, Andrew S., Timothy Taylor, Maria Constanza Ceruti, Jose Antonio Chavez, Johan Reinhard, Vaughan Grimes, Wolfram Meier-Augenstein, et al. 2007. “Stable Isotope and DNA Evidence for Ritual Sequences in Inca Child Sacrifice.” PNAS 104 (42): 16456–16461.
Acknowledgments
We are grateful to Lee Anne Zajicek, who coauthored the first edition. Her original contributions continue to be an integral part of this chapter. We thank the staff of the Maturango Museum, Ridgecrest, California. Specifically, for their generous help with photography and fossil images, we acknowledge Debbie Benson, executive director; Alexander K. Rogers, former archaeology curator; Sherry Brubaker, natural history curator; and Elaine Wiley, history curator. We thank Sharlene Paxton, a librarian at Cerro Coso Community College, Ridgecrest, California, for her guidance and expertise with OER and open-source images, and John Stenger-Smith and Claudia Sellers from Cerro Coso Community College, Ridgecrest, California, for their feedback on the chemistry and plant biology content. Finally, we thank William Zajicek and Lauren Zajicek, our community college students, for providing their impressions and extensive feedback on early drafts of the chapter.
Image Descriptions
Figure 7.6: Geologic time scale showing the geologic eons, eras, periods, epochs, and associated dates in millions of years ago (MYA). The time scale also shows the onset of major evolutionary and tectonic events affecting the North American continent and the Northern Cordillera (SCAK, south-central Alaska; SEAK, southeast Alaska; NAK, northern Alaska; CAK central Alaska). The following subdivisions and events are included on the time scale, from oldest to youngest. The oldest subdivision of the time scale is the Precambrian (symbolized by PC, X, Y, or Z in the GRI GIS data). The Precambrian is split into three eons: Hadean (4600-4000 MYA), Archean (4000-2500 MYA), and Proterozoic (2500-541 MYA). Global evolutionary and tectonic events that occurred during the Precambrian include (organized from oldest to youngest and including the eon in which the event occurred): formation of the Earth 4,600 MYA (Hadean); formation of the Earth’s crust (Hadean); origin of life (Hadean); oldest known Earth rocks (Archean); early bacteria and algae (stromatolies; Archean); simple multicelled organisms (Proterozoic); Kanektok Metamorphic Complex (oldest known rocks in Alaska; Proterozoic); and complex multicellular organisms (Proterozoic). The next subdivision of the timescale is the Phanerozoic Eon (541.0 MYA-present). The Phanerozoic Eon is split into three eras: Paleozoic (541.0-252.2 MYA; symbolized by PZ in the GRI GIS data), Mesozoic (252.2-66.0 MYA; symbolized by MZ in the GRI GIS data), and Cenozoic (66.0 MYA-present; symbolized by CZ in the GRI GIS data). The Paleozoic Era is split into seven periods (organized from oldest to youngest and including the geologic map symbol used in the GRI GIS data): Cambrian (541.0-485.4 MYA; C); Ordovician (485.4-443.4 MYA; O); Silurian (443.3-419.2 MYA; S); Devonian (419.2-358.9 MYA; D); Mississippian (358.9-323.2 MYA; M); Pennsylvanian (323.2-298.9 MYA; PN; the Mississippian and Pennsylvanian are also collectively known as the Carboniferous); and Permian (298.9-252.2; P). Major evolutionary and tectonic events that occurred during the Paleozoic include (organized from oldest to youngest and including the period in which the event occurred): Wales Orogeny (SEAK; Cambrian); early shelled organisms (Cambrian); rise of corals (Cambrian); trilobite maximum (Ordovician); primitive fish (Ordovician); mass extinction (Ordovician-Silurian); first land plants (Silurian), Kakas Orogeny (SEAK; Silurian); first forests (evergreens; Devonian); extensive plutonism and volcanism in the Yukon-Tanana and Brooks Range (Devonian); first amphibians (Devonian); mass extinction (Devonian); Ellesemerian Orogeny/Antler Orogeny (Devonian-Mississippian); ancestral Rocky Mountains (Mississippian); first reptiles (Mississippian); sharks abundant (Pennsylvanian); coal-forming swamps (Pennsylvanian); supercontinent Pangaea and Tethys Ocean (Pennsylvanian-Permian); and mass extinction (end Permian). The Mesozoic Era is split into three periods (organized from oldest to youngest and including the geologic map symbol used in the GRI GIS data): Triassic (252.2-201.3 MYA; Tr), Jurassic (201.3-145.0 MYA; J), and Cretaceous (145.0-66.0 MYA; K). Global evolutionary and tectonic events that occurred during the Mesozoic include (organized from oldest to youngest and including the period in which the event occurred): flying reptiles (Triassic); first dinosaurs and first mammals (Triassic); breakup of Pangaea begins (Triassic); mass extinction (end Triassic); Talkeetna arc (Jurassic); dinosaurs diverse and abundant (Jurassic); Brookian Orogeny (Jurassic-Cretaceous); early flowering plants (Cretaceous); opening of the Canada Basin and rotation of Arctic Alaska (Cretaceous); placental mammals (Cretaceous); exhumation of the Nome Complex (Cretaceous); extensive plutonism (Cretaceous), mass extinction (end Cretaceous). The Cenozoic Era is split into three periods (organized from oldest to youngest and including the geologic map symbol used in the GRI GIS data): Paleogene (66.0-23.0 MYA; PG), Neogene (23.0-2.6 MYA; N; together the Paleogene and Neogene are also known as the Tertiary [T]), and Quaternary (2.6 MYA-present; Q). The Paleogene is split into three shorter subdivisions called epochs: Paleocene (66.0-56.0 MYA; EP), Eocene (56.0-33.9 MYA; E), and Oligocene (33.9-23.0 OL). The Neogene is split into two epochs: Miocene (23.0-5.3 MYA; MI), and Pliocene (5.3-2.6 MYA; PL). The Quaternary is split into two epochs: Pleistocene (2.6-0.01 MYA; PE), and Holocene (0.01 MYA-present, H). Global evolutionary and tectonic events that occurred during the Mesozoic include (organized from oldest to youngest and including the epoch in which the event occurred): early primates (Paleocene); slab-window subduction (SCAK; Paleocene-Eocene), start of Bering Sea Volcanic eruptions (Oligocene); Alaska Range uplift (CAK; Oligocene); spread of grassy ecosystems (Miocene-Pliocene); modern humans (Pleistocene); ice age glaciations (Pleistocene); extinction of large mammals and birds (end Pleistocene); end of the ice age (end Pleistocene).
Figure 7.24: A Radiocarbon Date Calibration Curve. X axis: Calendar years ago (cal yr BP) ranging from 25000 (left) to 0 (right). Y axis: Radiocarbon Age (14C yr BP) ranging from 0 (bottom) to over 20000 (top). A slightly wavy line shows the calibration curve that goes from top left (23900 cal, 20000 radiocarbon) to bottom right (0,0). Lines point to other calibrated points: (18000 cal, 15000 radiocarbon), (11400 cal, 10000 radiocarbon), and (5700 cal, 5000 radiocarbon).
Figure 7.26: Graph of averaged oxygen isotope (δ18O) in deep sea sediment carbonate. The Y axis shows isotopic ratio δ18O permil ranging from -1.2 to +1.2. X axis displays thousands of years before present, ranging from 0 to 600. Data shows large swings from modern climate at -0.8 δ18O to +.7 δ18O around 20 thousand years ago (last Ice Age Maximum), back down to -0.8 δ18O last warm period about 120 thousand years ago. While not as dramatic, nor labeled, the graph also shows additional wide swings of δ18O measurements through time.
James Hutton’s theory that the world was much older than biblical explanations allowed. This age could be determined by gradual natural processes like soil erosion.
The slow movement of continents over time.
The theoretical perspective that the geologic processes observed today are the same as the processes operating in the past.
Mineralized copies of organisms or activity imprints.
Billion years ago.
Units of geologic time that span millions to billions of years and that are subdivided into periods and epochs.
Geologic time units that span millions of years and are subdivided into epochs.
The smallest units of geologic time, spanning thousands to millions of years.
The geologic epoch from 10 kya to present.
Thousand years ago.
The proposed name for our current geologic epoch based on human-driven climate change.
The study of what happens to an organism after death.
The process by which an organism becomes a fossil.
An oxygen-free environment.
The process by which the pressure of sediments squeeze extra water out of decaying remains and replace the voids that appear with minerals from the surrounding soil and groundwater.
When minerals from water impregnate or replace organic remains, leaving a fossilized copy of the organism.
A fossilized piece of wood in which the original organism is completely replaced by minerals through petrifaction.
Million years ago.
Species that are regarded as human, directly ancestral to humans, or very closely related to humans.
Large animals such as mammoths and mastodons.
Fossilized remains of activity such as footprints.
Hard, concrete-like substances found in the intestines of fossil creatures.
Fossilized poop.
When a fossil is embedded in a substance, such as igneous rock.
Natural rocks or mineral formations that can be mistaken for fossils.
Dating methods that do not result in numbers of years but, rather, in relative timelines wherein some organisms or artifacts are older or younger than others.
A relative dating method that is based on ordered layers or (strata) that build up over time.
The scientific law that states that rock and soil are deposited in layers, with the youngest layers on top and the oldest layers on the bottom.
A relative dating method that uses other plant and animal remains occurring in the stratigraphic context to establish time depth.
The relative dating method that arranges human-made artifacts in a time frame from oldest to youngest based on material, production technique, style, and other features.
A relative dating method that analyzes the absorption of fluorine in bones from the surrounding soils.
Dating methods that give estimated numbers of years for artifacts and sites.
Matter that cannot be broken down into smaller matter.
A small building block of matter.
Variants of elements.
Variants of elements that do not change over time without outside interference.
Variants of elements that spontaneously change into stable isotopes over time.
The process of transforming the atom by spontaneously releasing energy.
The chronometric dating method based on the radioactive decay of 14C in organic remains.
A chronometric dating method that uses the annual growth of trees to build a timeline into the past.
Single-celled marine organisms with shells.
A chronometric dating method that measures the ratio of argon gas in volcanic rock to estimate time elapsed since the volcanic rock cooled and solidified.
A chronometric dating method that measures the ratio of argon gas in volcanic rock to estimate time elapsed since the volcanic rock cooled and solidified.
A radiometric dating method based on the decay chain of unstable isotopes of 238U and 235U.
A chronometric dating method that is based on the fission of 283U.
The chronometric dating method based on the buildup of background radiation in pottery, clay, and soils.
A chronometric dating method that measures the background radiation accumulated in material over time.
Core samples taken from lake beds or other water sources for analysis of their pollen.
The study of the physical characteristics of the Earth’s surface.
Periods characterized by low global temperatures and the expansion of ice sheets on Earth’s surface.
DNA located in the mitochondria of a cell that is only passed down from biological mother to child.

.jpg)