3 Molecular Biology and Genetics
Hayley Mann, M.A., Binghamton University
This chapter is a revision from “Chapter 3: Molecular Biology and Genetics” by Hayley Mann, Xazmin Lowman, and Malaina Gaddis. In Explorations: An Open Invitation to Biological Anthropology, first edition, edited by Beth Shook, Katie Nelson, Kelsie Aguilera, and Lara Braff, which is licensed under CC BY-NC 4.0.
Learning Objectives
- Explain and identify the purpose of both DNA replication and the cell cycle.
- Identify key differences between mitosis and meiosis.
- Outline the process of protein synthesis, including transcription and translation.
- Use principles of Mendelian inheritance to predict genotypes and phenotypes of future generations.
- Explain complexities surrounding patterns of genetic inheritance and polygenic traits.
- Discuss challenges to and bioethical concerns of genetic testing.
I [Hayley Mann] started my Bachelor’s degree in 2003, which was the same year the Human Genome Project released its first draft sequence. I initially declared a genetics major because I thought it sounded cool. However, upon taking an actual class, I discovered that genetics was challenging. In addition to my genetics major, I signed up for biological anthropology classes and soon learned that anthropology could bring all those molecular lessons to life. For instance, we are composed of cells, proteins, nucleic acids, carbohydrates, and lipids. Anthropologists often include these molecules in their studies to identify how humans vary; if there are meaningful differences, they propose theories to explain them. Anthropologists study biomolecules in both living and ancient individuals. Ancient biomolecules can also be found on artifacts such as stone tools and cooking vessels. Over the years, scientific techniques for studying organic molecules have improved, which has unlocked new insights into the deep human past.
This chapter provides the basics for understanding human variation and how the evolutionary process works. A few advanced genetics topics are also presented because biotechnology is now commonplace in health and society. Understanding the science behind this remarkable field means you will be able to participate in bioethical and anthropological discussions as well as make more informed decisions regarding genetic testing.
Cells and Molecules
Molecules of Life
All organisms are composed of four basic types of molecules that are essential for cell structure and function: proteins, lipids, carbohydrates, and nucleic acids (Figure 3.1). Proteins are crucial for cell shape and nearly all cellular tasks, including receiving signals from outside the cell and mobilizing intra-cellular responses. Lipids are a class of organic compounds that include fats, oils, and hormones. As discussed later in the chapter, lipids are also responsible for the characteristic phospholipid bilayer structure of the cell membrane. Carbohydrates are sugar molecules and serve as energy to cells in the form of glucose. Lastly, nucleic acids, including deoxyribonucleic acid (DNA), carry genetic information about a living organism.
|
Molecule |
Definition |
Example |
|---|---|---|
|
Proteins |
Composed of one or more long chains of amino acids (i.e., basic units of protein) Often folded into complex 3D shapes that relate to function Proteins interact with other types of proteins and molecules |
Proteins come in different categories including structural (e.g., collagen, keratin, lactase, hemoglobin, cell membrane proteins), defense proteins (e.g, antibodies), enzymes (e.g., lactase), hormones (e.g., insulin), and motor proteins (e.g., actin) |
|
Lipids |
Insoluble in water due to hydrophilic (water-loving) head and a hydrophobic (water-repelling) tail |
Fats, such as triglycerides, store energy for your body Steroid hormones (e.g., estrogen and testosterone) act as chemical messengers to communicate between cells and tissues, as well as biochemical pathways inside of the cell |
|
Carbohydrates |
Large group of organic molecules that are composed of carbon and hydrogen atoms |
Starches and sugars, including blood glucose, provide cells with energy |
|
Nucleic Acids |
Carries the genetic information of an organism |
DNA RNA |
Cells
In 1665, Robert Hooke observed slices of plant cork using a microscope. Hooke noted that the microscopic plant structures he saw resembled cella, meaning “a small room” in Latin. Approximately two centuries later, biologists recognized the cell as being the most fundamental unit of life and that all life is composed of cells. Cellular organisms can be characterized as two main cell types: prokaryotes and eukaryotes (Figure 3.2).
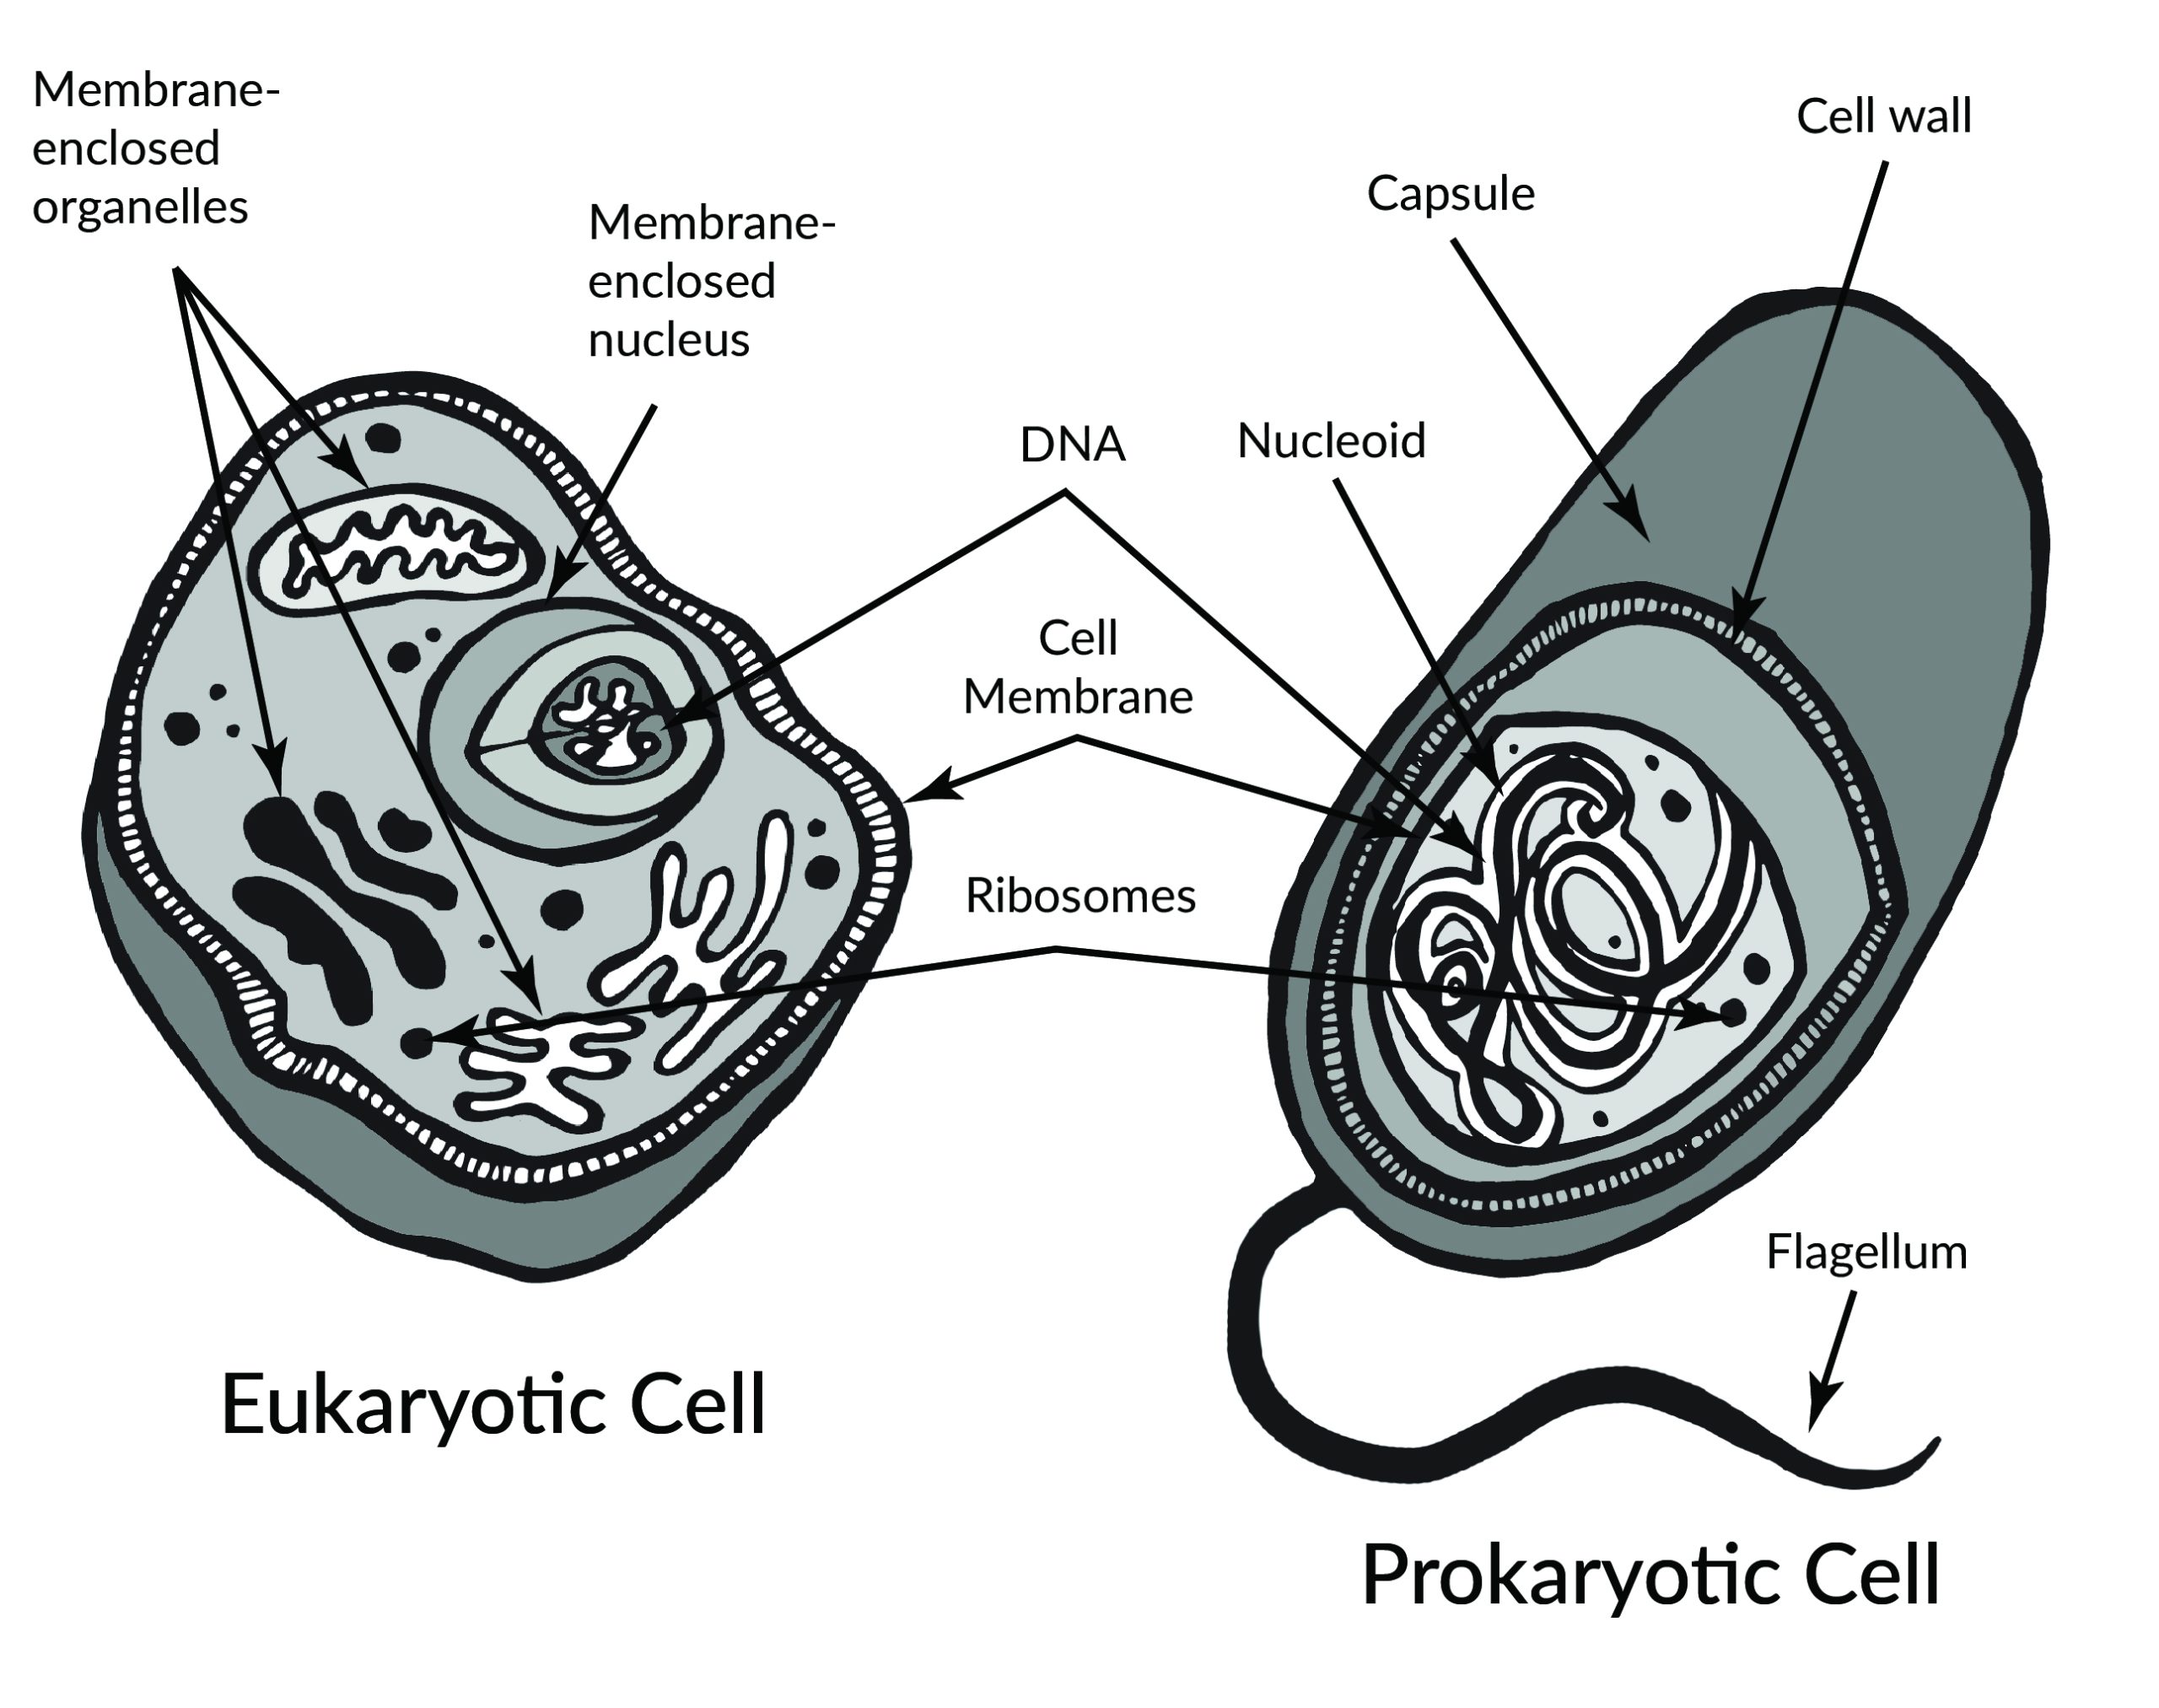
Prokaryotes include bacteria and archaea, and they are composed of a single cell. Additionally, their DNA and organelles are not surrounded by individual membranes. Thus, no compartments separate their DNA from the rest of the cell (see Figure 3.2). It is well known that some bacteria can cause illness in humans. For instance, Escherichia coli (E. coli) and Salmonella contamination can result in food poisoning symptoms. Pneumonia and strep throat are caused by Streptococcal bacteria. Neisseria gonorrhoeae is a sexually transmitted bacterial disease. Although bacteria are commonly associated with illness, not all bacteria are harmful. For example, researchers are studying the relationship between the microbiome and human health. The bacteria that are part of the healthy human microbiome perform beneficial roles, such as digesting food, boosting the immune system, and even making vitamins (e.g., B12 and K).
Eukaryotes can be single-celled or multi-celled in their body composition. In contrast to prokaryotes, eukaryotes possess membranes that surround their DNA and organelles. An example of a single-celled eukaryote is the microscopic algae found in ponds (phytoplankton), which can produce oxygen from the sun. Yeasts are also single-celled, and fungi can be single- or multicellular. Plants and animals are all multicellular.
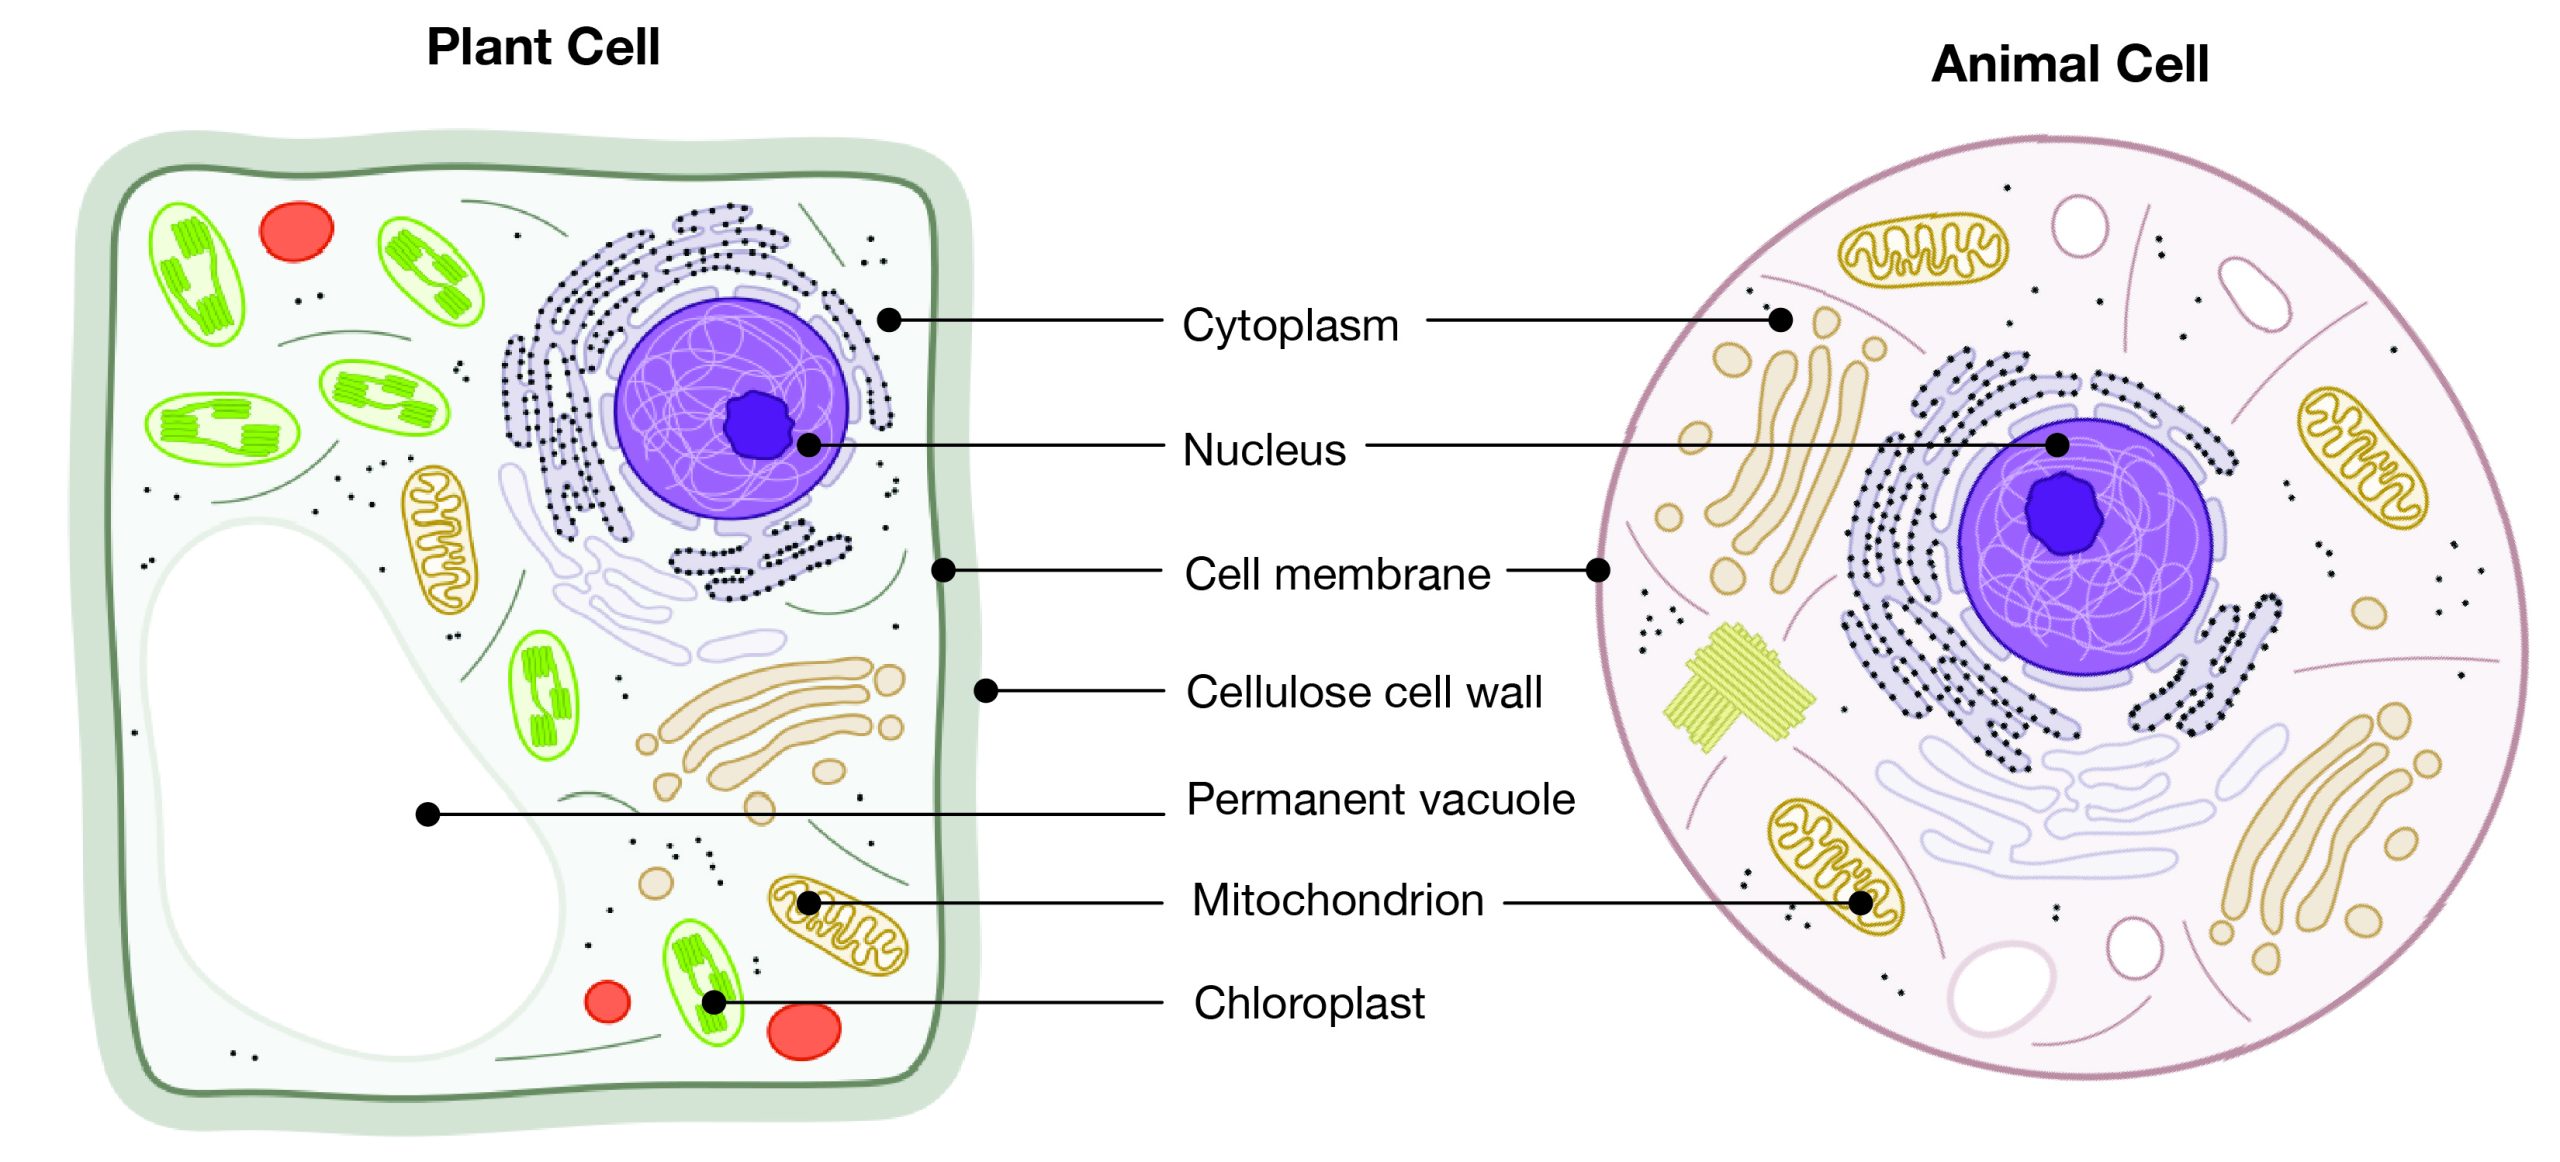
Although plant and animal cells have a surprising number of similarities, there are some key differences (Figure 3.3). For example, plant cells possess a thick outer cell membrane made of a fibrous carbohydrate called cellulose. Animal and plant cells also have different tissues. A tissue is an aggregation of cells that are morphologically similar and perform the same task. For most plants, the outermost layer of cells forms a waxy cuticle that helps to protect the cells and to prevent water loss. Humans have skin, which is the outermost cell layer that is predominantly composed of a tough protein called keratin. Overall, humans have a diversity of tissue types (e.g., cartilage, brain, and heart).
Animal Cell Organelles
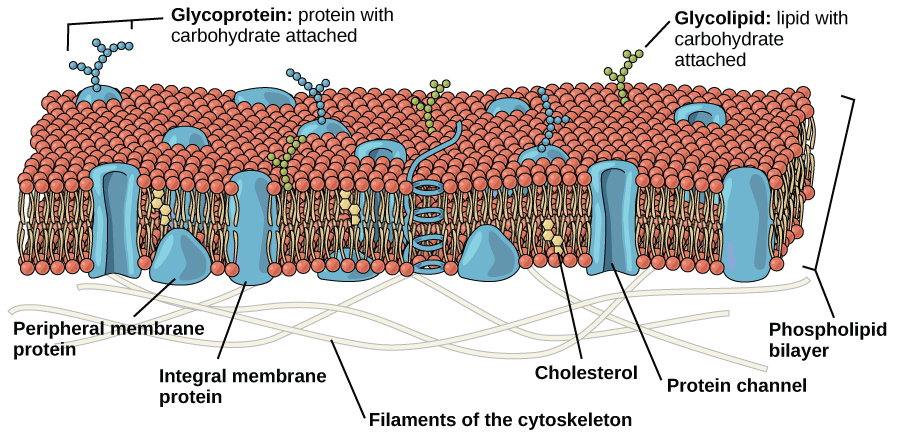
An animal cell is surrounded by a double membrane called the phospholipid bilayer (Figure 3.4). A closer look reveals that this protective barrier is made of lipids and proteins that provide structure and function for cellular activities, such as regulating the passage of molecules and ions (e.g., H2O and sodium) into and out of the cell. Cytoplasm is the jelly-like matrix inside of the cell membrane. Part of the cytoplasm comprises organelles, which perform different specialized tasks for the cell (Figure 3.5). An example of an organelle is the nucleus, where the cell’s DNA is located.
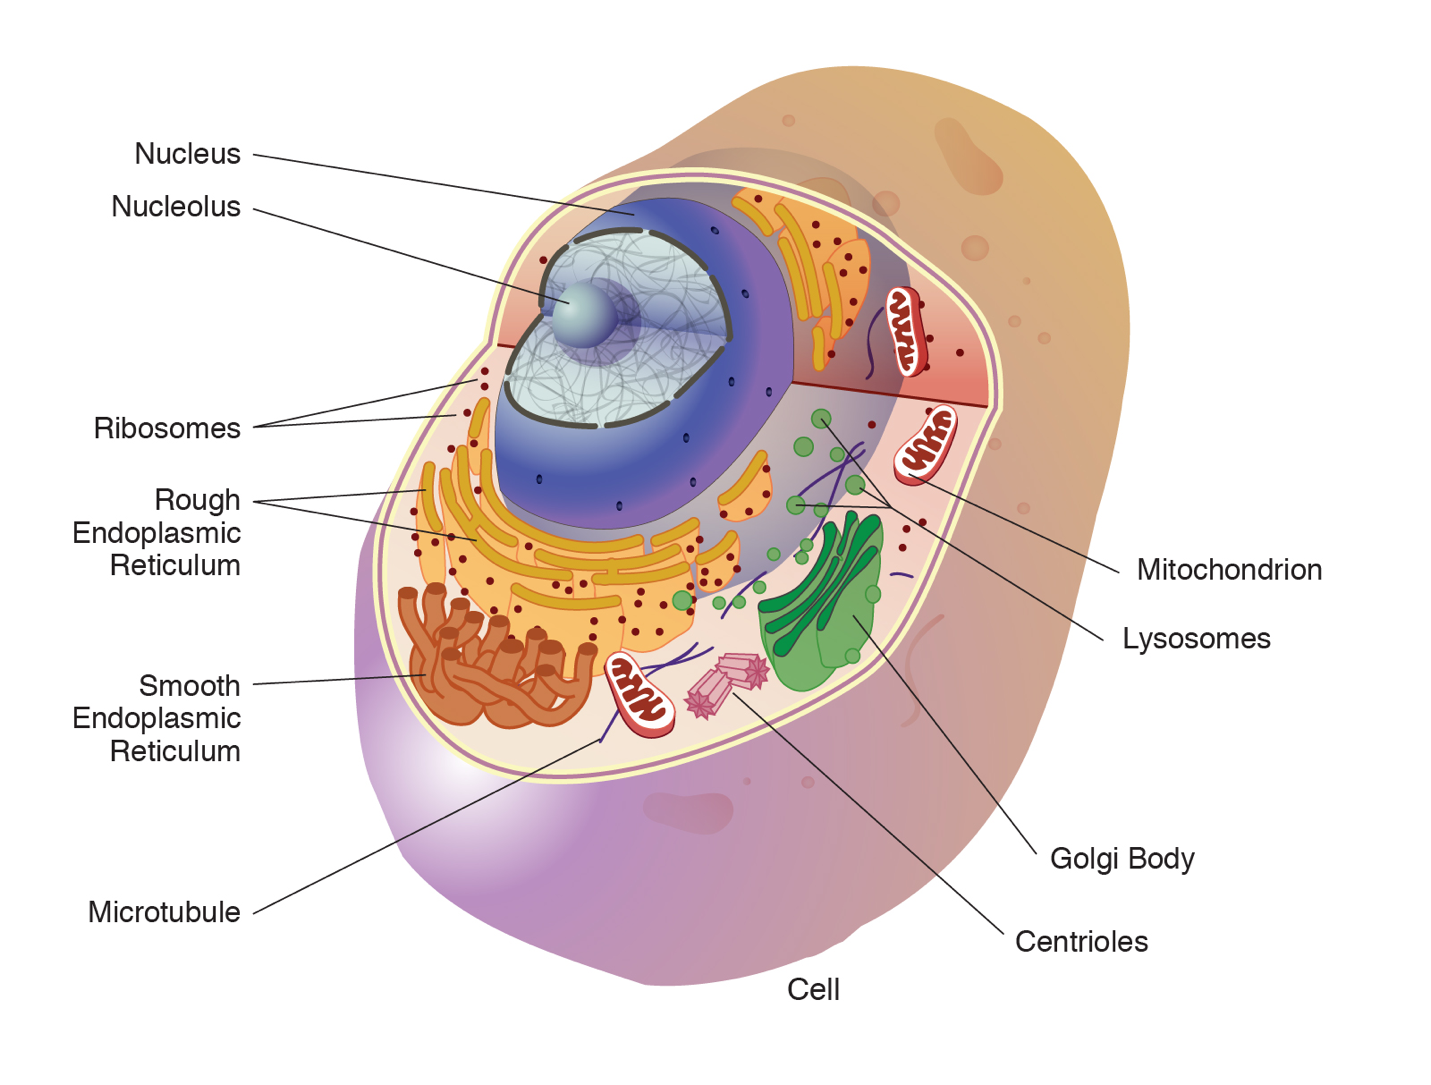
Another organelle is the mitochondrion. Mitochondria are often referred to as “powerhouse centers” because they produce energy for the cell in the form of adenosine triphosphate (ATP). Depending on the species and tissue type, multicellular eukaryotes can have hundreds to thousands of mitochondria in each of their cells. Scientists have determined that mitochondria were once symbiotic prokaryotic organisms (i.e., helpful bacteria) that transformed into cellular organelles over time. This evolutionary explanation helps explain why mitochondria also have their own DNA, called mitochondrial DNA (mtDNA). All organelles have important physiological functions and disease can occur when organelles do not perform their role optimally. Figure 3.6 lists other organelles found in the cell and their specialized cellular roles.
|
Cell structure |
Description |
|---|---|
|
Centrioles |
Assist with the organization of mitotic spindles, which extend and contract for the purpose of cellular movement during mitosis and meiosis. |
|
Cytoplasm |
Gelatinous fluid located inside of cell membrane that contains organelles. |
|
Endoplasmic reticulum (ER) |
Continuous membrane with the nucleus that helps transport, synthesize, modify, and fold proteins. Rough ER has embedded ribosomes, whereas smooth ER lacks ribosomes. |
|
Golgi body |
Layers of flattened sacs that receive and transmit messages from the ER to secrete and transport proteins within the cell. |
|
Lysosome |
Located in the cytoplasm; contains enzymes to degrade cellular components. |
|
Microtubule |
Involved with cellular movement including intracellular transport and cell division. |
|
Mitochondrion |
Responsible for cellular respiration, where energy is produced by converting nutrients into ATP. |
|
Nucleolus |
Resides inside of the nucleus and is the site of ribosomal RNA (rRNA) transcription, processing, and assembly. |
|
Nucleopore |
Pores in the nuclear envelope that are selectively permeable. |
|
Nucleus |
Contains the cell’s DNA and is surrounded by the nuclear envelope. |
|
Ribosome |
Located in the cytoplasm and also the membrane of the rough endoplasmic reticulum. Messenger RNA (mRNA) binds to ribosomes and proteins are synthesized. |
Introduction to Genetics
Genetics is the study of heredity. Biological parents pass down their genetic traits to their offspring. Although children resemble their parents, genetic traits often vary in appearance or molecular function. For example, two parents with normal color vision can sometimes produce a son with red-green colorblindness. Patterns of genetic inheritance will be discussed in a later section. Molecular geneticists study the biological mechanisms responsible for creating variation between individuals, such as DNA mutations (see Chapter 4), cell division, and genetic regulation.
Molecular anthropologists use genetic data to test anthropological questions. Some of these anthropologists utilize ancient DNA (aDNA), which is DNA that is extracted from anything once living, including human, animal, and plant remains. Over time, DNA becomes degraded (i.e., less intact), but specialized laboratory techniques can make copies of short degraded aDNA segments, which can then be reassembled to provide more complete DNA information. A recent example of an aDNA study is provided in Special Topic: Native American Immunity and European Diseases, and aDNA is also explored in Appendix D.
DNA Structure
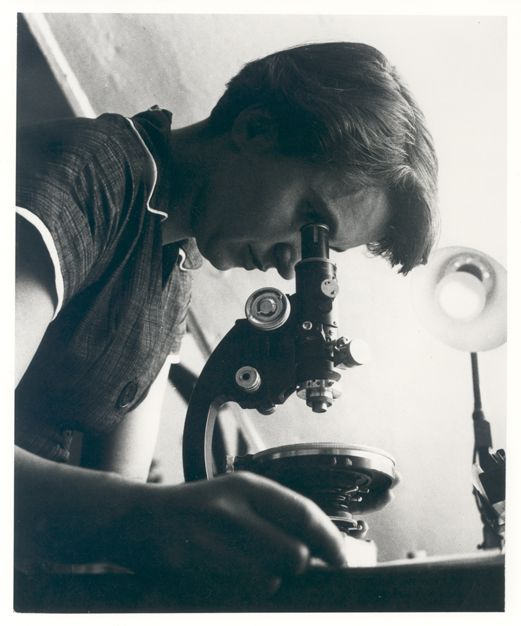
The discovery, in 1953, of the molecular structure of deoxyribonucleic acid (DNA) was one of the greatest scientific achievements of all time. Using X-ray crystallography, Rosalind Franklin (Figure 3.7) provided the image that clearly showed the double helix shape of DNA. However, due to a great deal of controversy, Franklin’s colleague and outside associates received greater publicity for the discovery. In 1962, James Watson, Francis Crick, and Maurice Wilkins received a Nobel Prize for developing a biochemical model of DNA. Unfortunately, Rosalind Franklin had passed away in 1958 from ovarian cancer. In current times, Franklin’s important contribution and her reputation as a skilled scientist are widely acknowledged.
The double helix shape of DNA can be described as a twisted ladder (Figure 3.8). More specifically, DNA is a double-stranded molecule with its two strands oriented in opposite directions (i.e., antiparallel). Each strand is composed of nucleotides with a sugar phosphate backbone. There are four different types of DNA nucleotides: adenine (A), thymine (T), cytosine (C), and guanine (G). The two DNA strands are held together by nucleotide base pairs, which have chemical bonding rules. The complementary base-pairing rules are as follows: A and T bond with each other, while C and G form a bond. The chemical bonds between A-T and C-G are formed by “weak” hydrogen atom interactions, which means the two strands can be easily separated. A DNA sequence is the order of nucleotide bases (A, T, G, C) along only one DNA strand. If one DNA strand has the sequence CATGCT, then the other strand will have a complementary sequence GTACGA. This is an example of a short DNA sequence. In reality, there are approximately three billion DNA base pairs in human cells.

DNA Is Highly Organized within the Nucleus
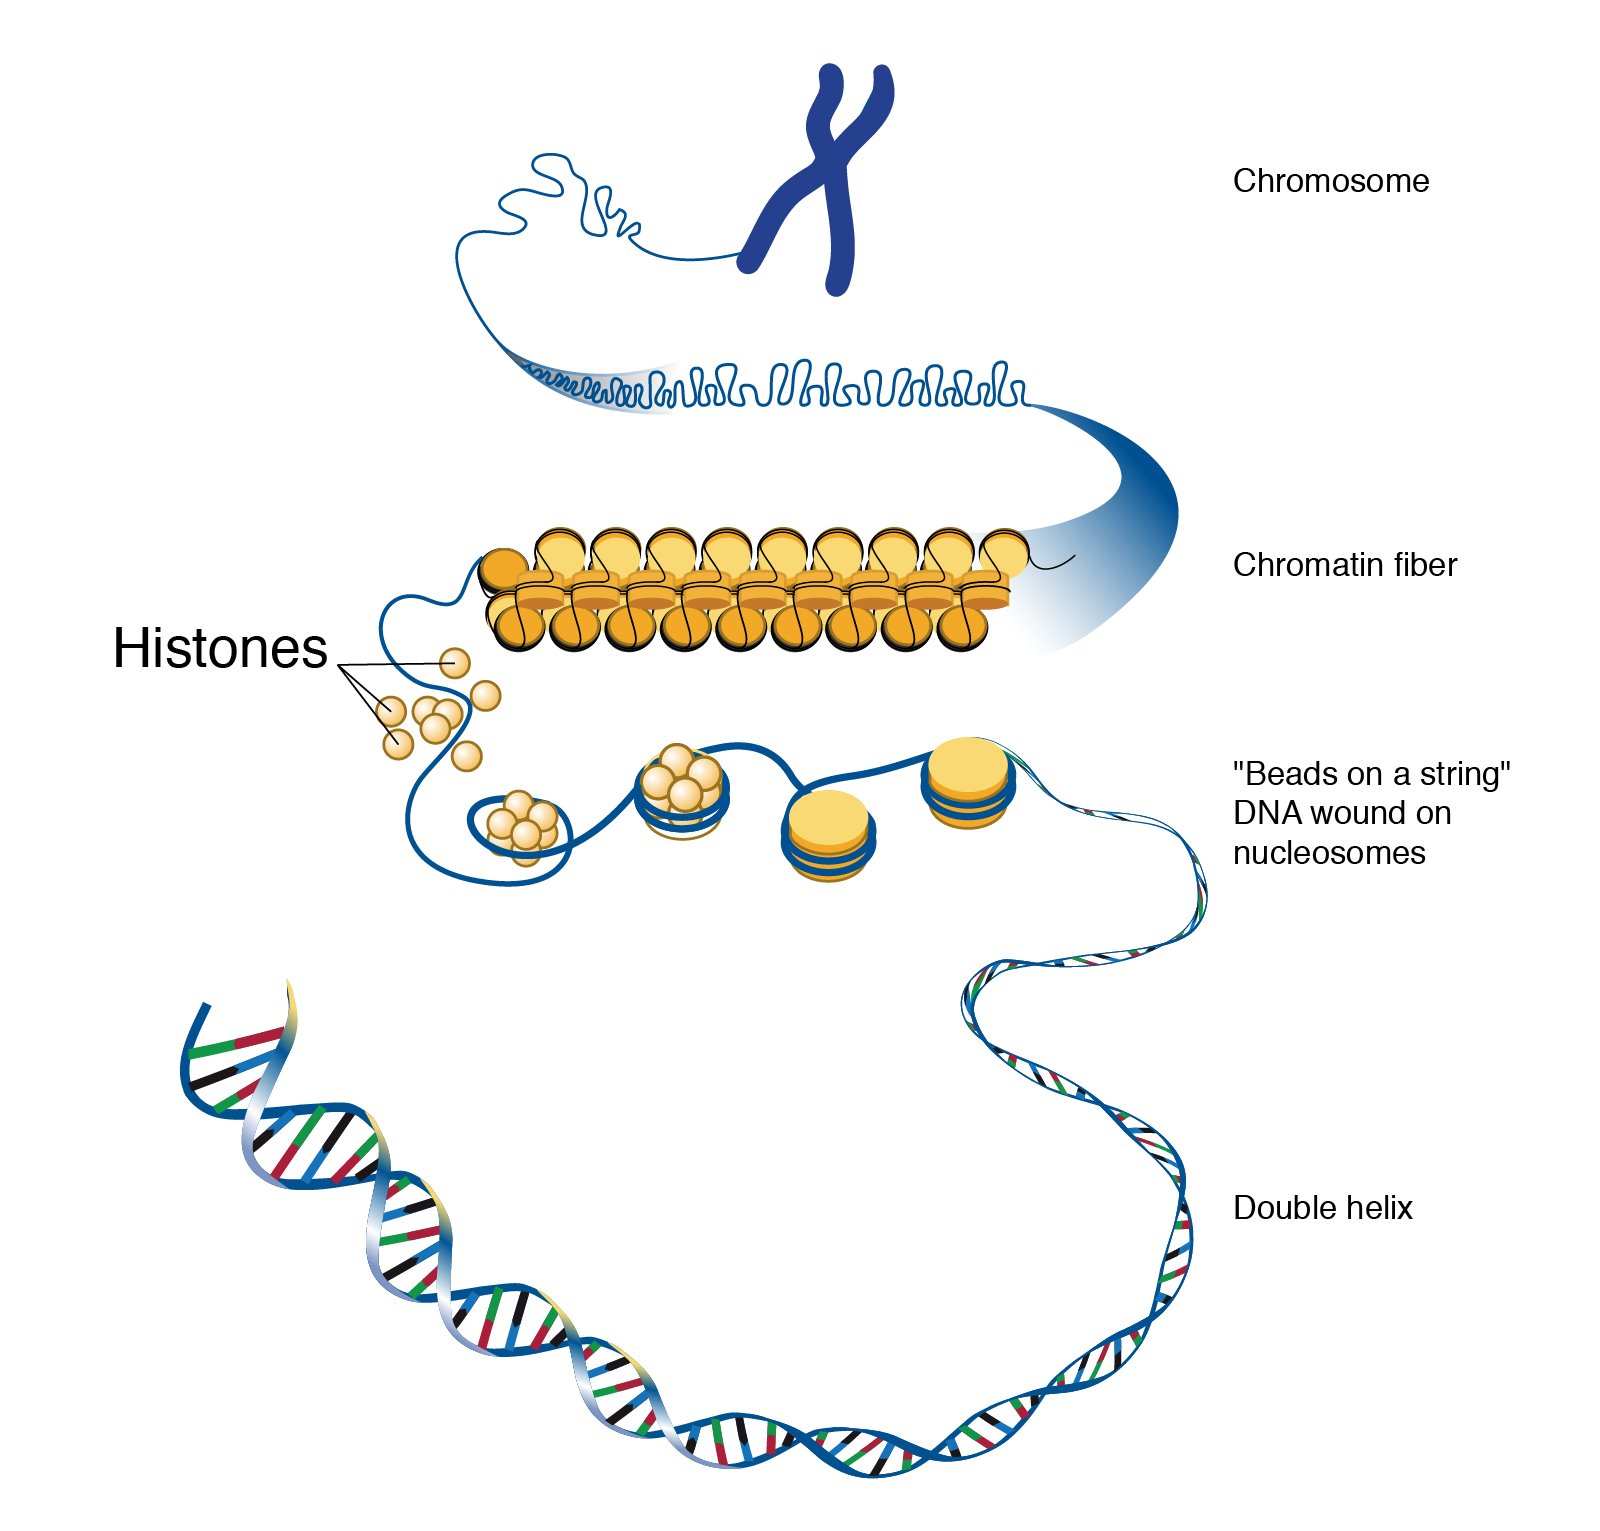
If you removed the DNA from a single human cell and stretched it out completely, it would measure approximately two meters (about 6.5 feet). Therefore, DNA molecules must be compactly organized in the nucleus. To achieve this, the double helix configuration of DNA undergoes coiling. An analogy would be twisting a string until coils are formed and then continuing to twist so that secondary coils are formed, and so on. To assist with coiling, DNA is first wrapped around proteins called histones. This creates a complex called chromatin, which resembles “beads on a string” (Figure 3.9). Next, chromatin is further coiled into a chromosome. Another important feature of DNA is that chromosomes can be altered from tightly coiled (chromatin) to loosely coiled (euchromatin). Most of the time, chromosomes in the nucleus remain in a euchromatin state so that DNA sequences are accessible for regulatory processes to occur.

Human body cells typically have 23 pairs of chromosomes, for a total of 46 chromosomes in each cell’s nucleus. An interesting fact is that the number of chromosomes an organism possesses varies by species, and this figure is not dependent upon the size or complexity of the organism. For instance, chimpanzees have a total of 48 chromosomes, while hermit crabs have 254. Chromosomes also have a distinct physical structure, including centromeres (the “center”) and telomeres (the ends) (Figure 3.10). Because of the centromeric region, chromosomes are described as having two different “arms,” where one arm is long and the other is shorter. Centromeres play an important role during cell division, which will be discussed in the next section. Telomeres are located at the ends of chromosomes; they help protect the chromosomes from degradation after every round of cell division.
Special Topic: Native American Immunity and European Diseases—A Study of Ancient DNA
Beginning in the early fifteenth century, Native Americans progressively suffered from high mortality rates as the result of colonization from foreign powers. European-borne diseases such as measles, tuberculosis, influenza, and smallpox are largely responsible for the population collapse of indigenous peoples in the Americas. Many Europeans who immigrated to the Americas had lived in large sedentary populations, which also included coexisting with domestic animals and pests. Although a few prehistoric Native American populations can be characterized as large agricultural societies (especially in Mesoamerica), their overall culture, community lifestyle, and subsistence practices were markedly different from that of Europeans. Therefore, because they did not share the same urban living environments as Europeans, it is believed that Native Americans were susceptible to many European diseases.
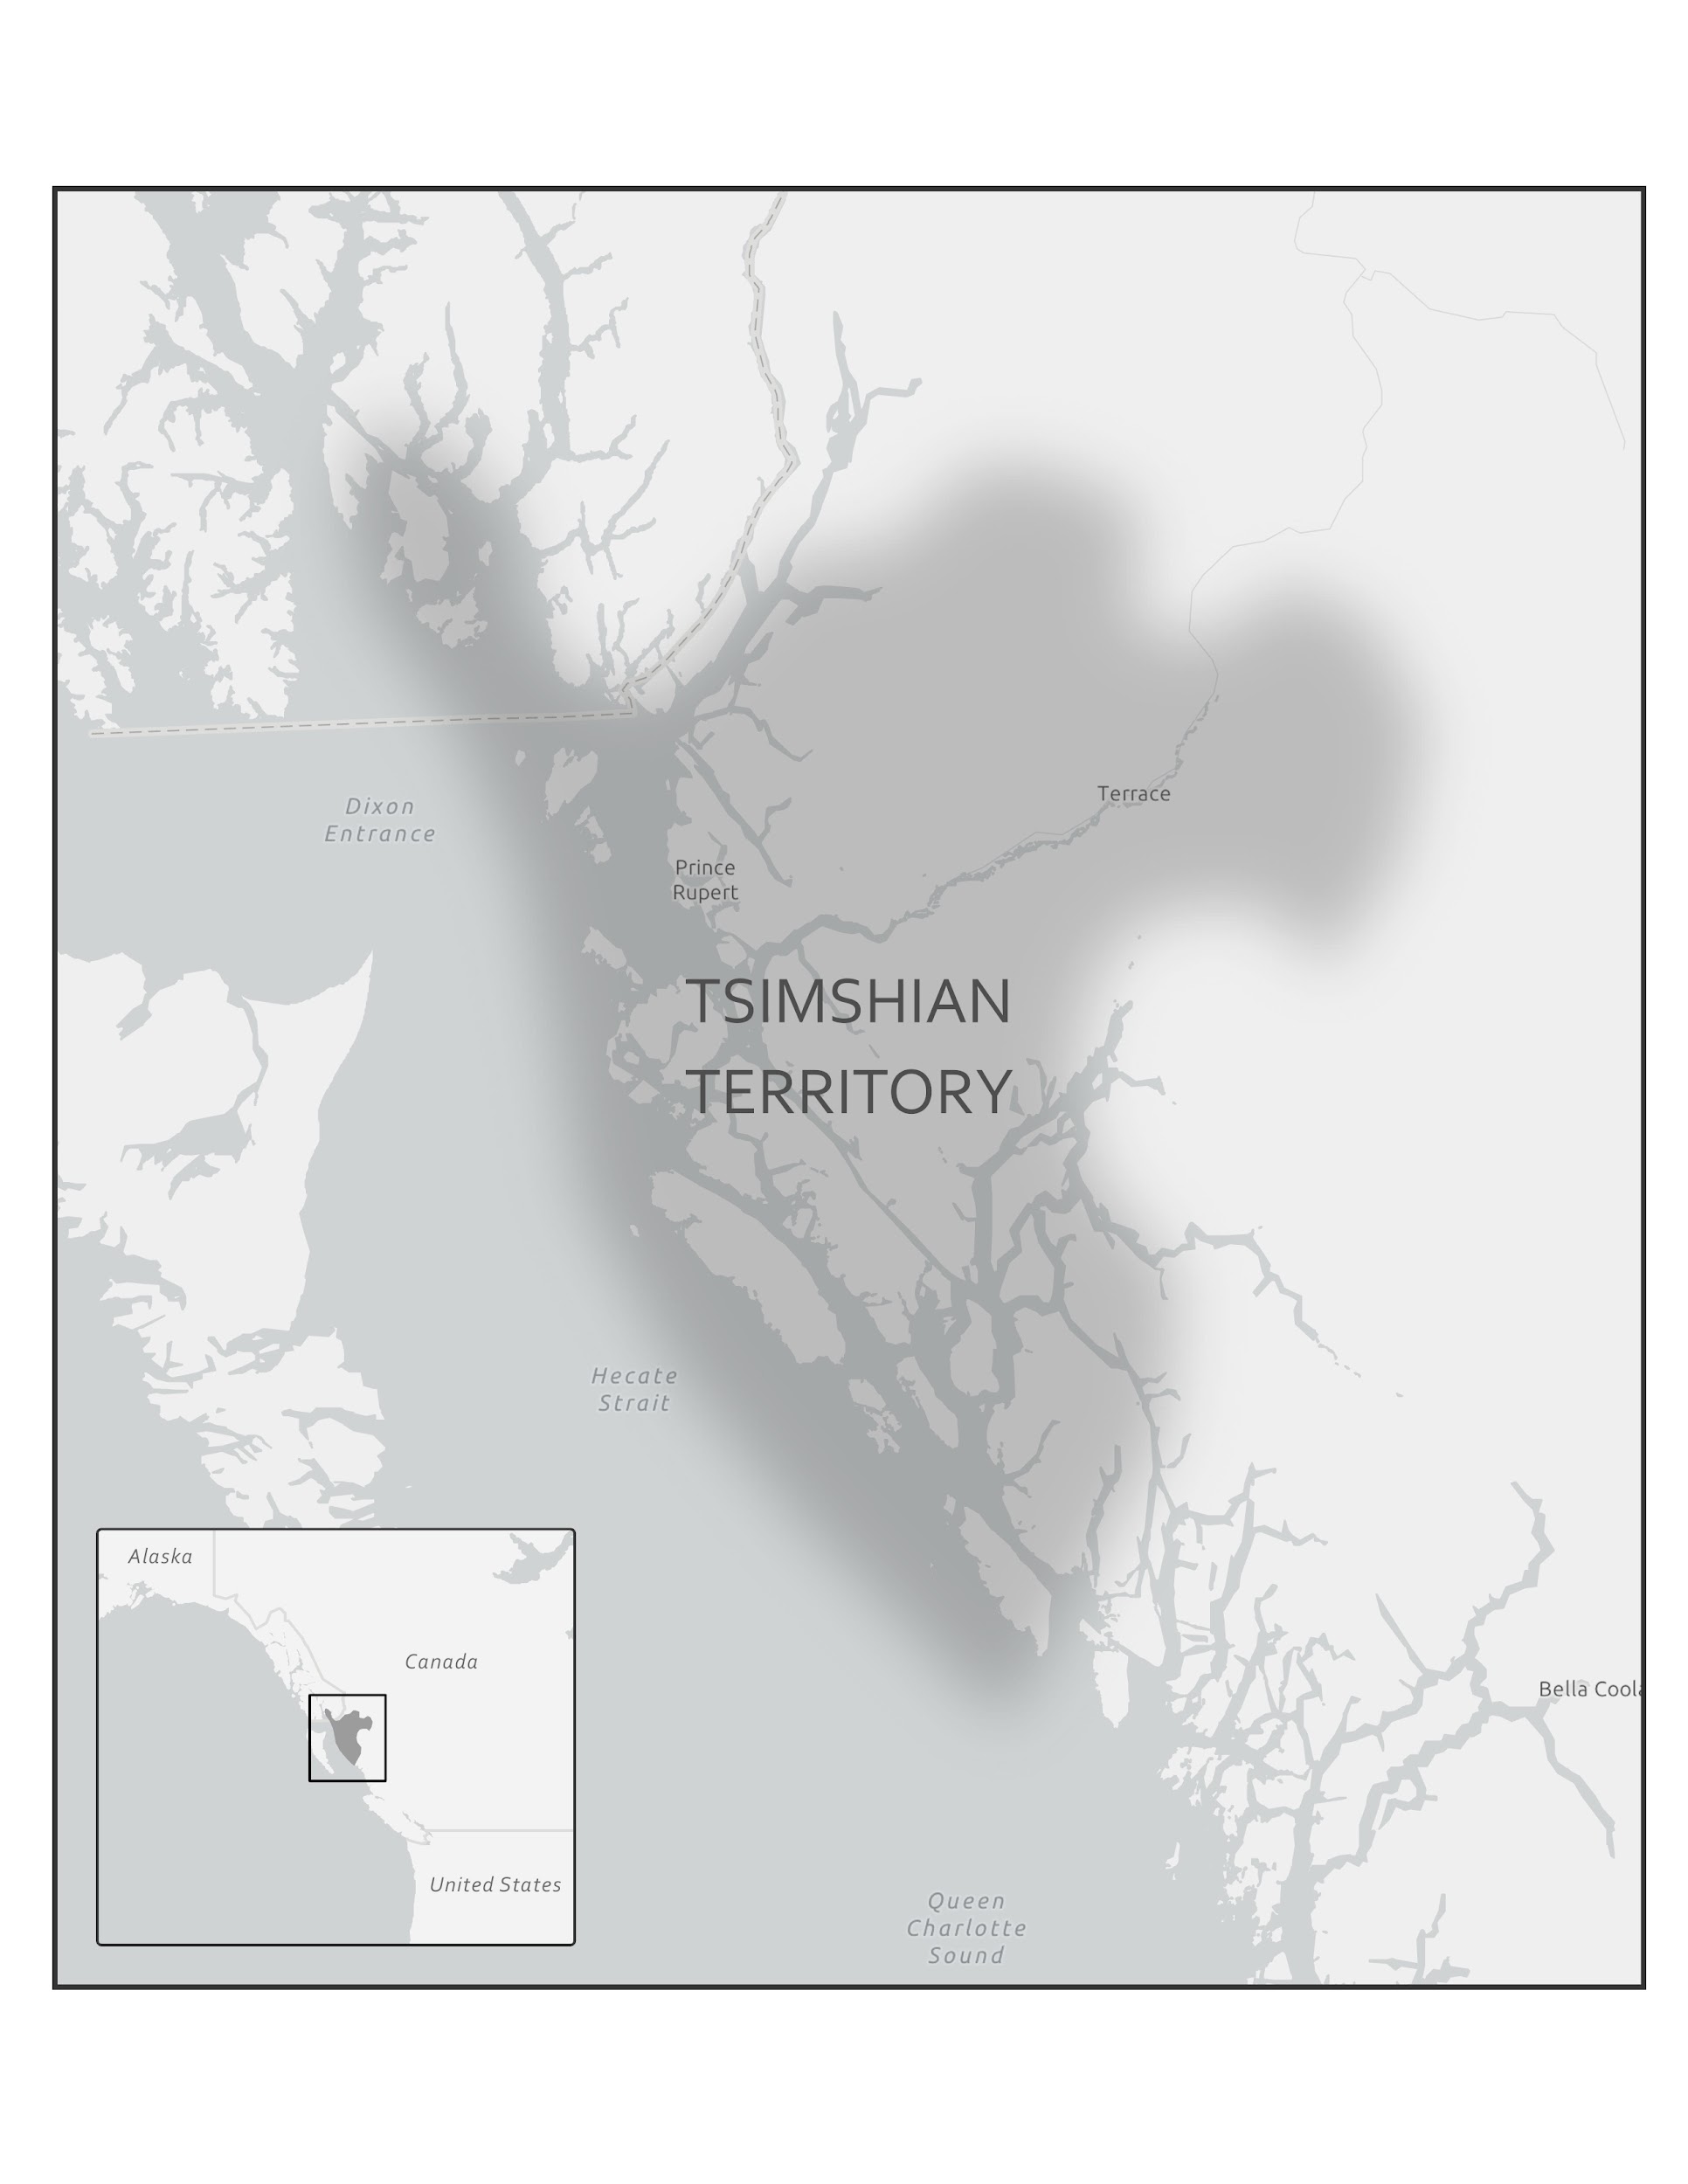
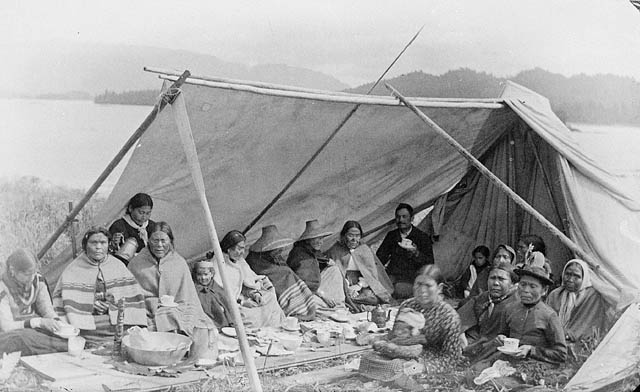
In 2016, a Nature article published by John Lindo and colleagues was the first to investigate whether pre-contact Native Americans possessed a genetic susceptibility to European diseases. Their study included Tsimshians, a First Nation community from British Columbia (Figure 3.11a-b). DNA from both present-day and ancient individuals (who lived between 500 and 6,000 years ago) was analyzed. The research team discovered that a change occurred in the HLA-DQA1 gene, which is a member of the major histocompatibility complex (MHC) immune system molecules. MHC molecules are responsible for detecting and triggering an immune response against pathogens. Lindo and colleagues (2016) concluded that HLA-DQA1 gene helped Native Americans adapt to their local environmental ecology. However, when European-borne epidemics occurred in the Northwest during the 1800s, a certain HLA-DQA1 DNA sequence variant (allele) associated with ancient Tsimshian immunity was no longer adaptive. As the result of past selective pressures from European diseases, present-day Tsimshians have different HLA-DQA1 allele frequencies. The precise role that HLA-DQA1 plays in immune adaptation requires further investigation. But overall, this study serves as an example of how studying ancient DNA from the remains of deceased individuals can help provide insight into living human populations and historical events.
DNA Replication and Cell Division
For life to continue and flourish, cells must be able to divide. Tissue growth and cellular damage repair are also necessary to maintain an organism throughout its life. All these rely on the dynamic processes of DNA replication and the cell cycle. The mechanisms highlighted in this section are tightly regulated and represent only part of the life cycle of a cell.
DNA Replication
DNA replication is the process by which new DNA is copied from an original DNA template. It is one phase of the highly coordinated cell cycle, and it requires a variety of enzymes with special functions. The creation of a complementary DNA strand from a template strand is described as semi-conservative replication. The result of semi-conservative replication is two separate double-stranded DNA molecules, each of which is composed of an original “parent” template strand and a newly synthesized “daughter” DNA strand.
DNA replication progresses in three steps referred to as initiation, elongation, and termination. During initiation, enzymes are recruited to specific sites along the DNA sequence (Figure 3.12). For example, an initiator enzyme, called helicase, “unwinds” DNA by breaking the hydrogen bonds between the two parent strands. The unraveling of the helix into two separated strands exposes the strands and creates a fork, which is the active site of DNA replication.
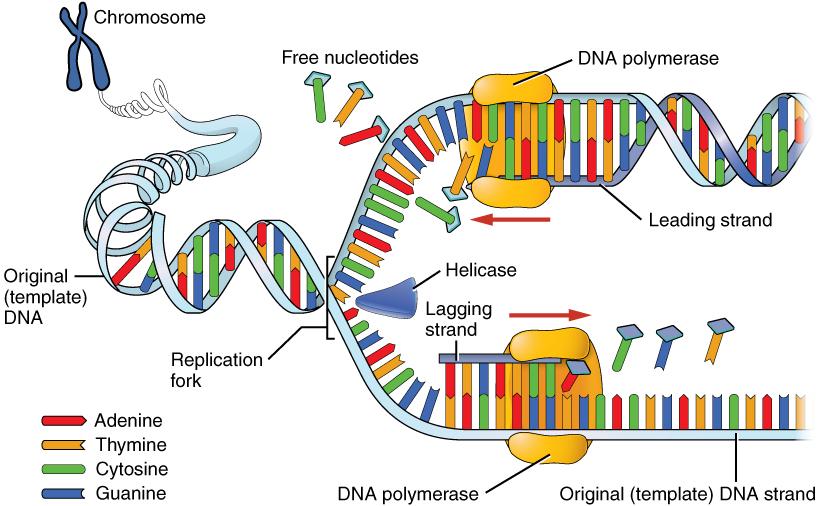
Elongation is the assembly of new DNA daughter strands from the exposed original parent strands. The two parent strands can further be classified as leading strand or lagging strand and are distinguished by the direction of replication. Enzymes called DNA polymerases read parent template strands in a specific direction. Complementary nucleotides are added, and the newly formed daughter strands will grow. On the leading parent strand, a DNA polymerase will create one continuous strand. The lagging parent strand is created in several disconnected sections and other enzymes fill in the missing nucleotide gaps between these sections.
Finally, termination refers to the end of DNA replication activity. It is signaled by a stop sequence in the DNA that is recognized by machinery at the replication fork. The end result of DNA replication is that the number of chromosomes are doubled so that the cell can divide into two.
DNA Mutations
DNA replication should result in the creation of two identical DNA nucleotide sequences. However, although DNA polymerases are quite precise during DNA replication, copying mistakes are estimated to occur every 107 DNA nucleotides. Variation from the original DNA sequence is known as a mutation. The different types of mutations will be discussed in greater detail in Chapter 4. Briefly, mutations can result in single nucleotide changes, as well as the insertion or deletion of nucleotides and repeated sequences. Depending on where they occur in the genome, mutations can be deleterious (harmful). For example, mutations may occur in regions that control cell cycle regulation, which can result in cancer (see Special Topic: The Cell Cycle and Immortality of Cancer Cells). Many other types of mutations, however, are not harmful to an organism.
Regardless of their effect, the cell attempts to reduce the frequency of mutations that occur during DNA replication. To accomplish this, there are polymerases with proofreading capacities that can identify and correct mismatched nucleotides. These safeguards reduce the frequency of DNA mutations so that they only occur every 109 nucleotides.
Mitotic Cell Division
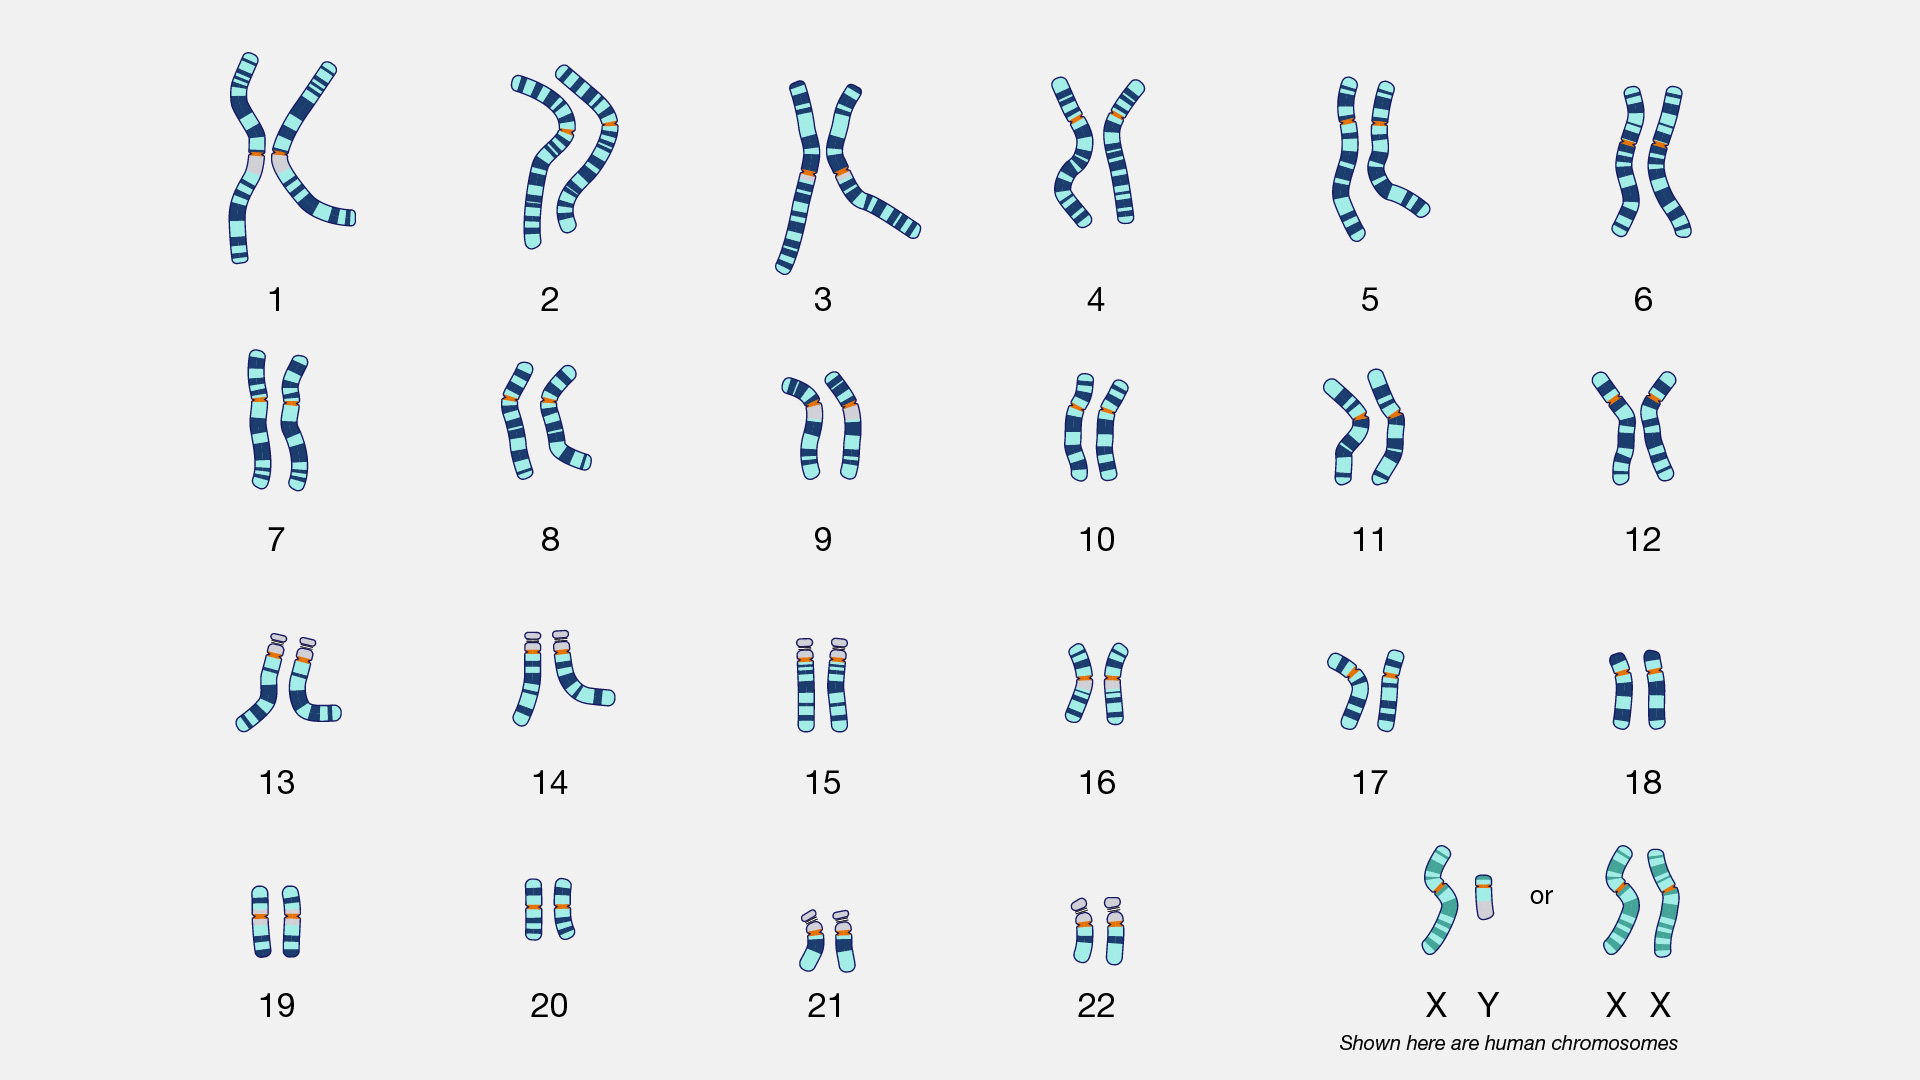
There are two types of cells in the body: germ cells (sperm and egg) and somatic cells. The body and its various tissues comprises somatic cells. Organisms that contain two sets of chromosomes in their somatic cells are called diploid organisms. Humans have 46 chromosomes and they are diploid because they inherit one set of chromosomes (n = 23) from each parent. As a result, they have 23 matching pairs of chromosomes, which are known as homologous chromosomes. As seen in Figure 3.13, homologous chromosome pairs vary in size and are generally numbered from largest (chromosome 1) to smallest (chromosome 22) with the exception of the 23rd pair, which is made up of the sex chromosomes (X and Y). Typically, the female sex is XX and the male sex is XY. Individuals inherit an X chromosome from their chromosomal mother and an X or Y from their chromosomal father.
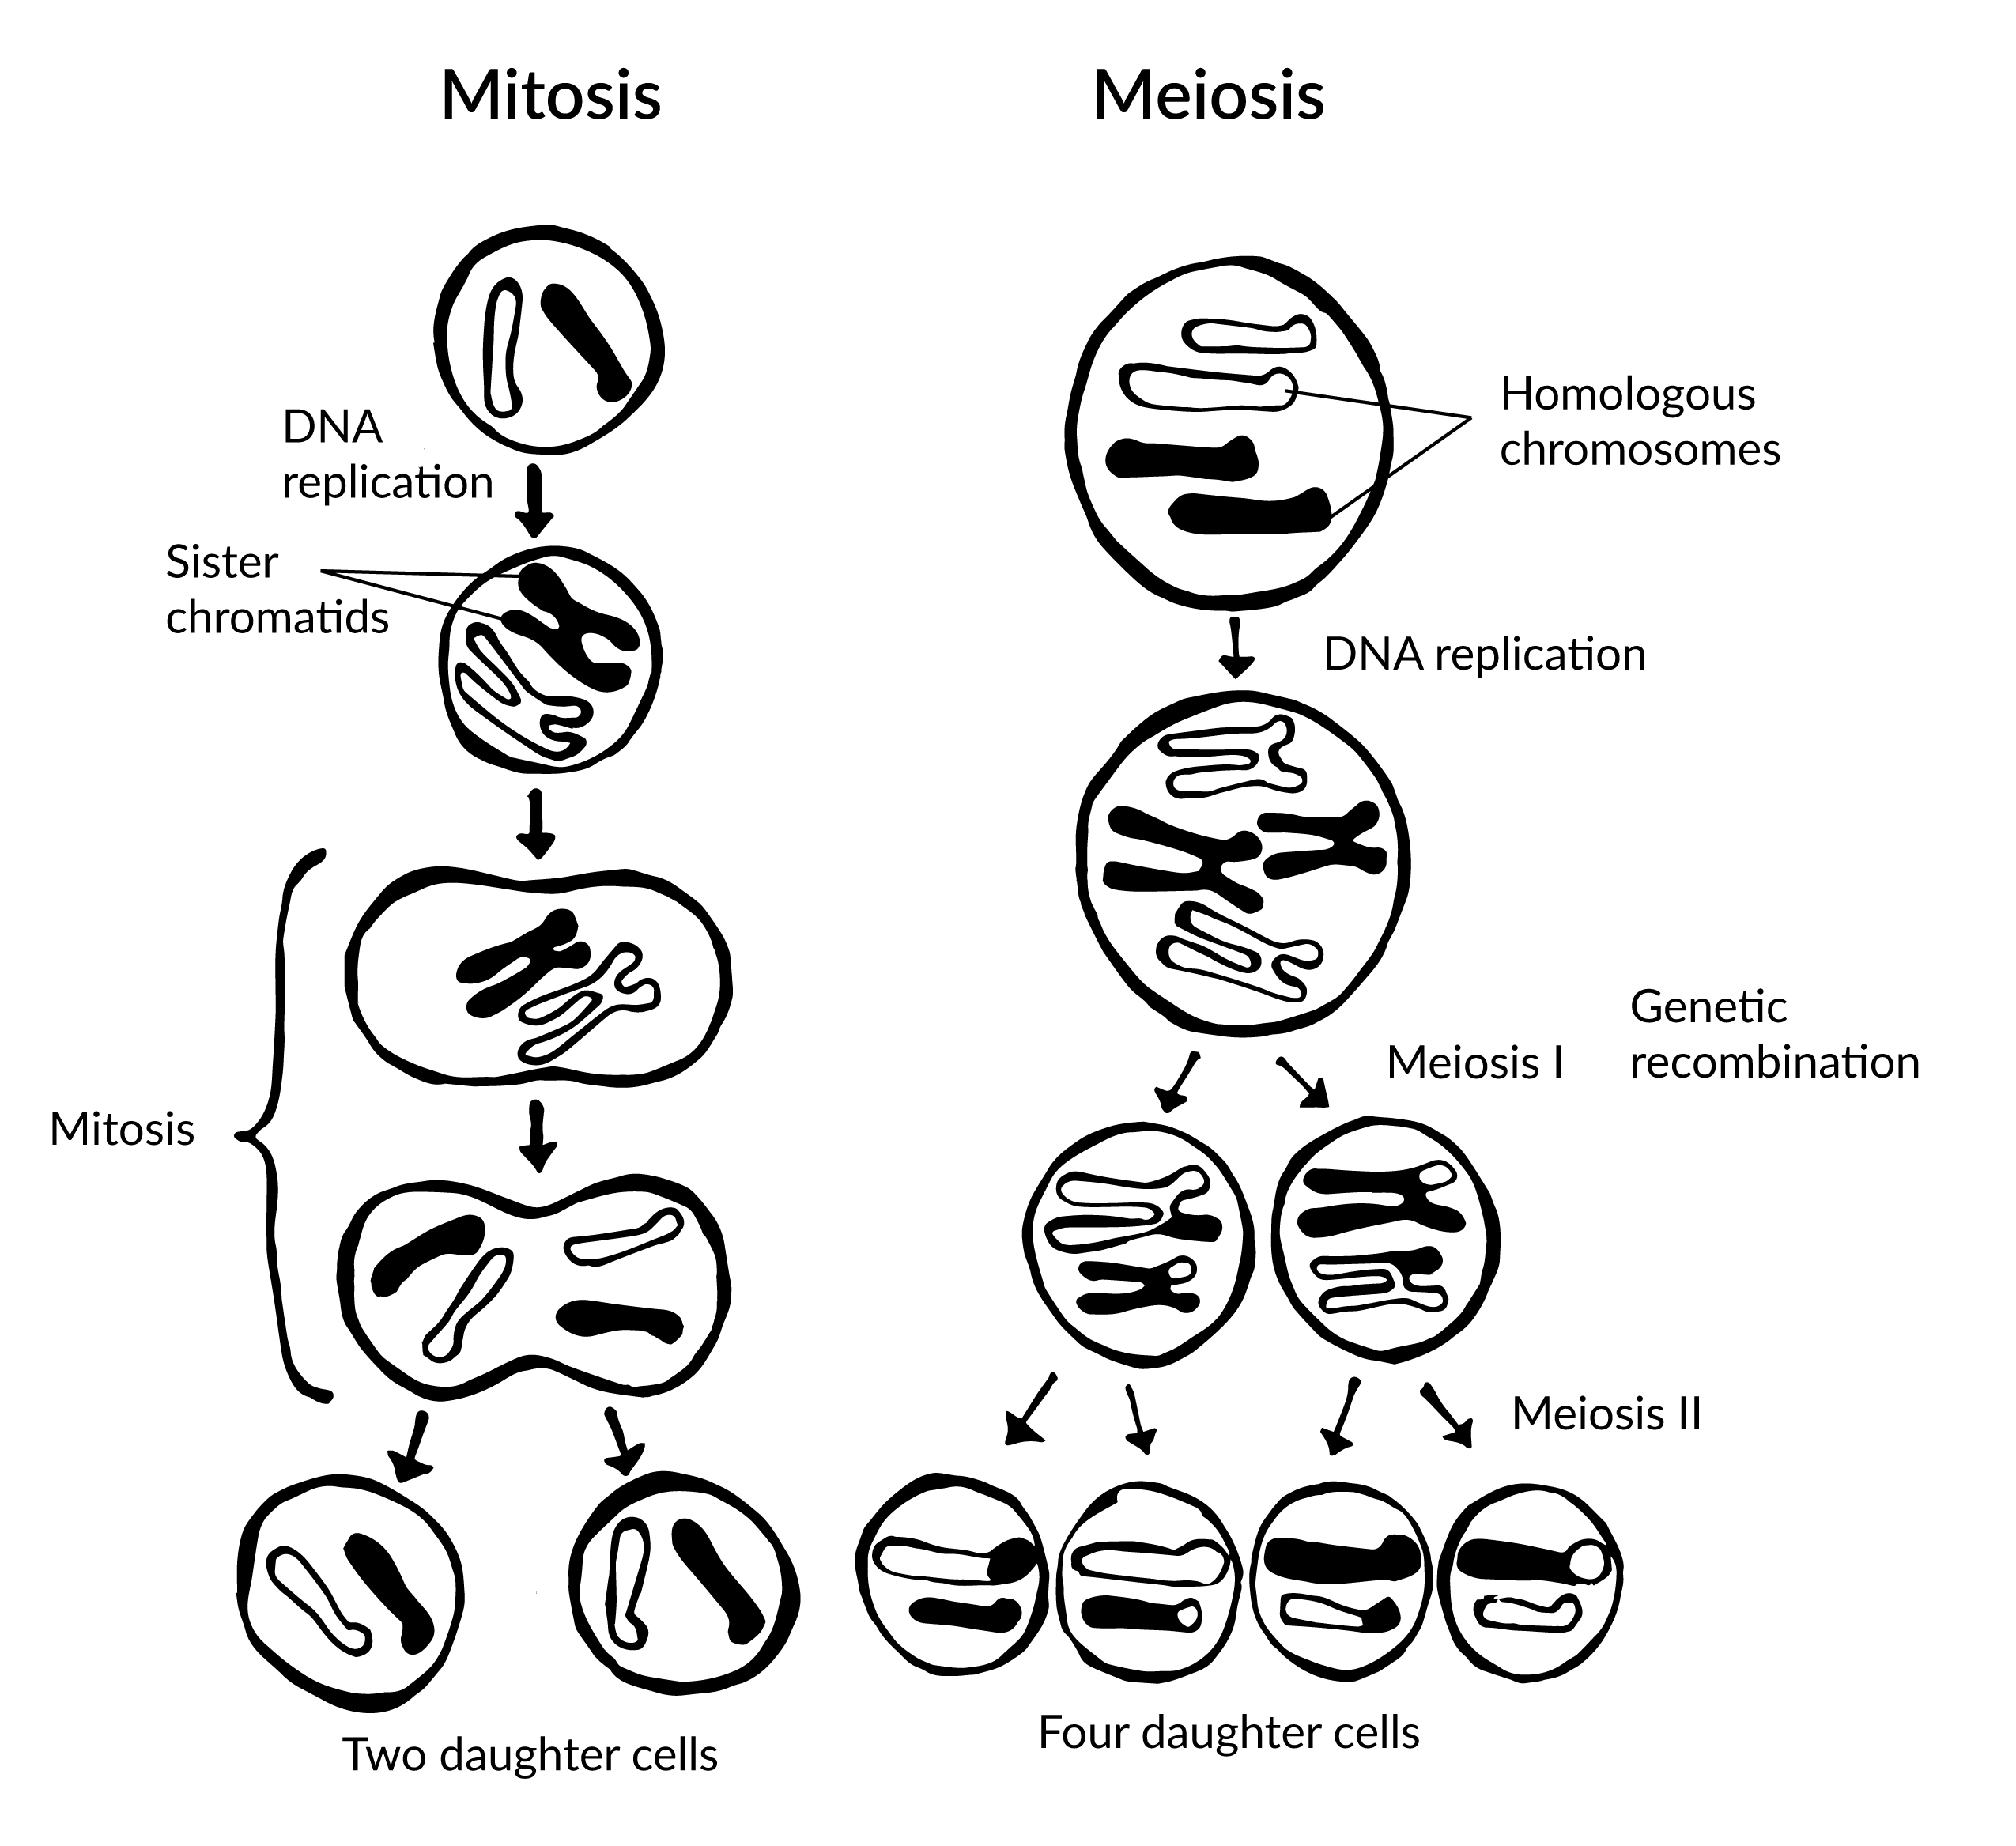
To grow and repair tissues, somatic cells must divide. As discussed previously, for cell division to occur, a cell must first replicate its genetic material. During DNA replication, each chromosome produces double the amount of genetic information. The duplicated arms of chromosomes are known as sister chromatids, and they are attached at the centromeric region. To elaborate, the number of chromosomes stays the same (n = 46); however, the amount of genetic material is doubled in the cell as the result of replication.
Mitosis is the process of somatic cell division that gives rise to two diploid daughter cells. Figure 3.14 includes a brief overview of mitosis. Once DNA and other organelles in the cell have finished replication, mitotic spindle fibers physically align each chromosome at the center of the cell. Next, the spindle fibers divide the sister chromatids and move each one to opposite sides of the cell. At this phase, there are 46 chromosomes on each side of a human cell. The cell can now divide into two fully separated daughter cells.
Meiotic Cell Division
Gametogenesis is the production of gametes (sperm and egg cells); it involves two rounds of cell division called meiosis. Similar to mitosis, the parent cell in meiosis is diploid. However, meiosis has a few key differences, including the number of daughter cells produced (four cells, which require two rounds of cell division to produce) and the number of chromosomes each daughter cell has (see Figure 3.14).
During the first round of division (known as meiosis I), each chromosome (n = 46) replicates its DNA so that sister chromatids are formed. Next, with the help of spindle fibers, homologous chromosomes align near the center of the cell and sister chromatids physically swap genetic material. In other words, the sister chromatids of matching chromosomes cross over with each other at matching DNA nucleotide positions. The occurrence of homologous chromosomes crossing over, swapping DNA, and then rejoining segments is called genetic recombination. The “genetic shuffling” that occurs in gametes increases organismal genetic diversity by creating new combinations of genes on chromosomes that are different from the parent cell. Genetic mutations can also arise during recombination. For example, there may be an unequal swapping of genetic material that occurs between the two sister chromatids, which can result in deletions or duplications of DNA nucleotides. Once genetic recombination is complete, homologous chromosomes are separated and two daughter cells are formed.
The daughter cells after the first round of meiosis are haploid, meaning they only have one set of chromosomes (n = 23). During the second round of cell division (known as meiosis II), sister chromatids are separated and two additional haploid daughter cells are formed. Therefore, the four resulting daughter cells have one set of chromosomes (n = 23), and they also have a genetic composition that is not identical to the parent cells nor to each other.
Although both sperm and egg gamete production undergo meiosis, they differ in the final number of viable daughter cells. In the case of spermatogenesis, four mature sperm cells are produced. Although four egg cells are also produced in oogenesis, only one of these egg cells will result in an ovum (mature egg). During fertilization, an egg cell and sperm cell fuse, which creates a diploid cell that develops into an embryo. The ovum also provides the cellular organelles necessary for embryonic cell division. This includes mitochondria, which is why humans, and most other multicellular eukaryotes, have the same mtDNA sequence as their mothers.
Chromosomal Disorders: Aneuploidies
During mitosis or meiosis, entire deletions or duplications of chromosomes can occur due to error. For example, homologous chromosomes may fail to separate properly, so one daughter cell may end up with an extra chromosome while the other daughter cell has one less. Cells with an unexpected (or abnormal) number of chromosomes are known as aneuploid. Adult or embryonic cells can be tested for chromosome number (karyotyping). Aneuploid cells are typically detrimental to a dividing cell or developing embryo, which can lead to a loss of pregnancy. However, the occurrence of individuals being born with three copies of the 21st chromosome is relatively common; this genetic condition is known as Down Syndrome. Moreover, individuals can also be born with aneuploid sex chromosome conditions such as XXY, XXX, and XO (referring to only one X chromosome).
Special Topic: The Cell Cycle and Immortality of Cancer Cells
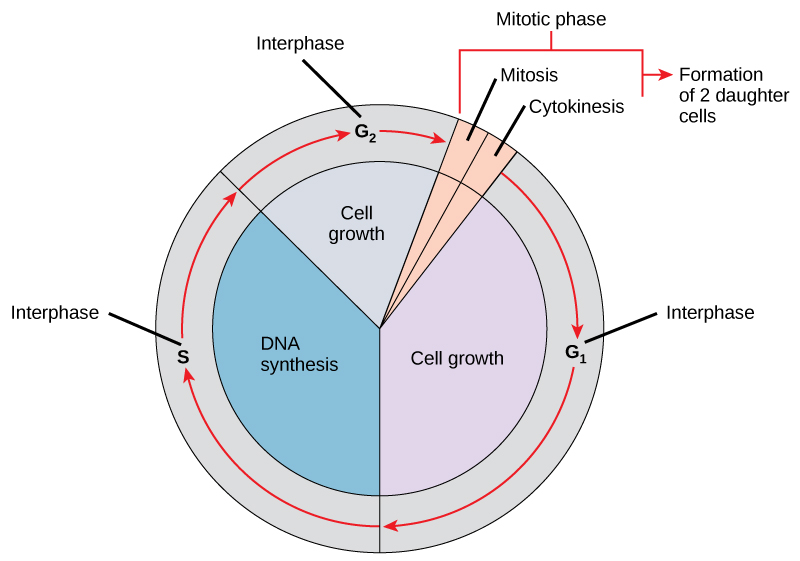
DNA replication is part of a series of preparatory phases that a cell undergoes prior to cell division, collectively known as interphase (Figure 3.15). During interphase, the cell not only doubles its chromosomes through DNA replication, but it also increases its metabolic capacity to provide energy for growth and division. Transition into each phase of the cell cycle is tightly controlled by proteins that serve as checkpoints. If a cell fails to pass a checkpoint, then DNA replication and/or cell division will not continue. Some of the reasons why a cell may fail at a checkpoint is DNA damage, lack of nutrients to continue the process, or insufficient size. In turn, a cell may undergo apoptosis, which is a mechanism for cell death.
Unchecked cellular growth is a distinguishing hallmark of cancer. In other words, as cancer cells grow and proliferate, they acquire the capacity to avoid death and replicate indefinitely. This uncontrolled and continuous cell division is also known as “immortality.” As previously mentioned, most cells lose the ability to divide due to shortening of telomeres on the ends of chromosomes over time. One way in which cancer cells retain replicative immortality is that the length of their telomeres is continuously protected. Chemotherapy, often used to treat cancer, targets the cell cycle (especially cell division) to halt the propagation of genetically abnormal cells. Another therapeutic approach that continues to be investigated is targeting telomere activity to stop the division of cancer cells.
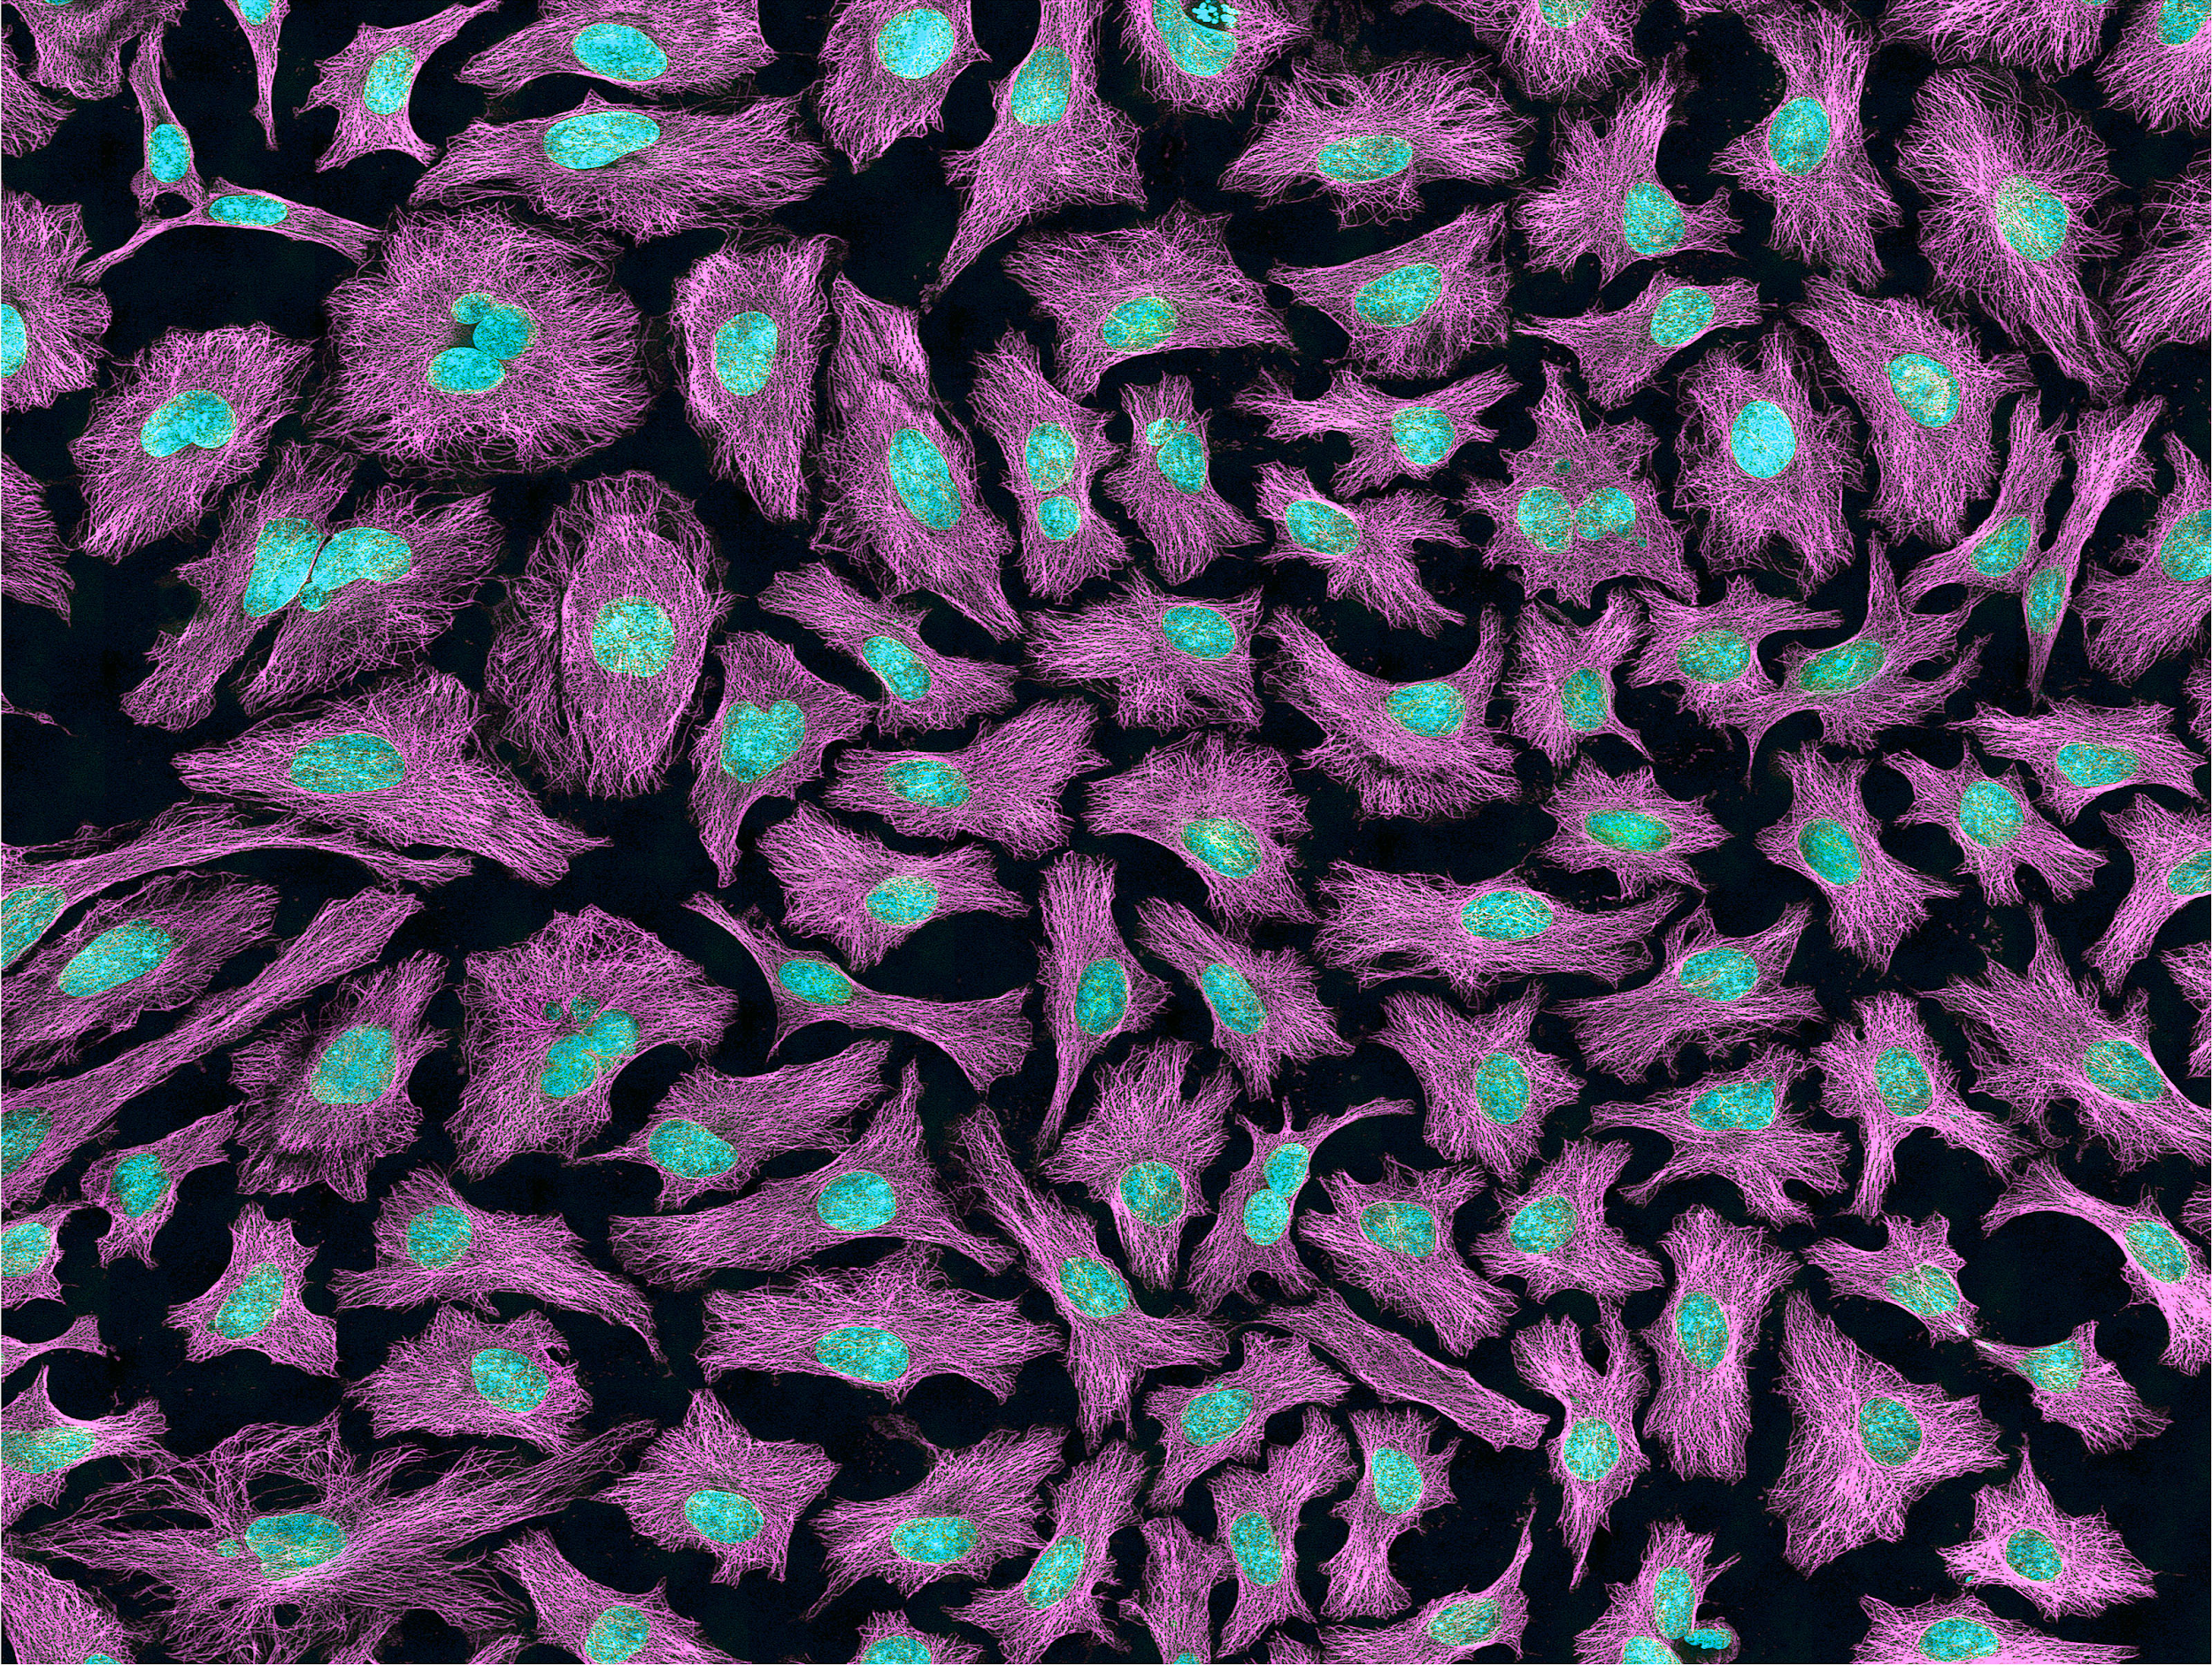
Researchers have exploited the immortality of cancer cells for molecular research. The oldest immortal cell line is HeLa cells (Figure 3.16), which were harvested from Henrietta Lacks, an African American woman diagnosed with cervical cancer in 1955. At that time, extracted cells frequently died during experiments, but surprisingly HeLa cells continued to replicate. Propagation of Lacks’s cell line has significantly contributed to medical research, including contributing to ongoing cancer research and helping to test the polio vaccine in the 1950s. However, Lacks had not given her consent for her tumor biopsy to be used in cell culture research. Moreover, her family was unaware of the extraction and remarkable application of her cells for two decades. The history of HeLa cell origin was first revealed in 1976. The controversy voiced by the Lacks family was included in an extensive account of HeLa cells published in Rebecca Skloot’s 2010 book, The Immortal Life of Henrietta Lacks. A film based on the book was also released in 2017 (Wolfe 2017).
Protein Synthesis
At the beginning of the chapter, we defined proteins as strings of amino acids that fold into complex 3-D shapes. There are 20 standard amino acids that can be strung together in different combinations in humans, and the result is that proteins can perform an impressive amount of different functions. For instance, muscle fibers are proteins that help facilitate movement. A special class of proteins (immunoglobulins) help protect the organism by detecting disease-causing pathogens in the body. Protein hormones, such as insulin, help regulate physiological activity. Blood hemoglobin is a protein that transports oxygen throughout the body. Enzymes are also proteins, and they are catalysts for biochemical reactions that occur in the cell (e.g., metabolism). Larger-scale protein structures can be visibly seen as physical features of an organism (e.g., hair and nails).
Transcription and Translation
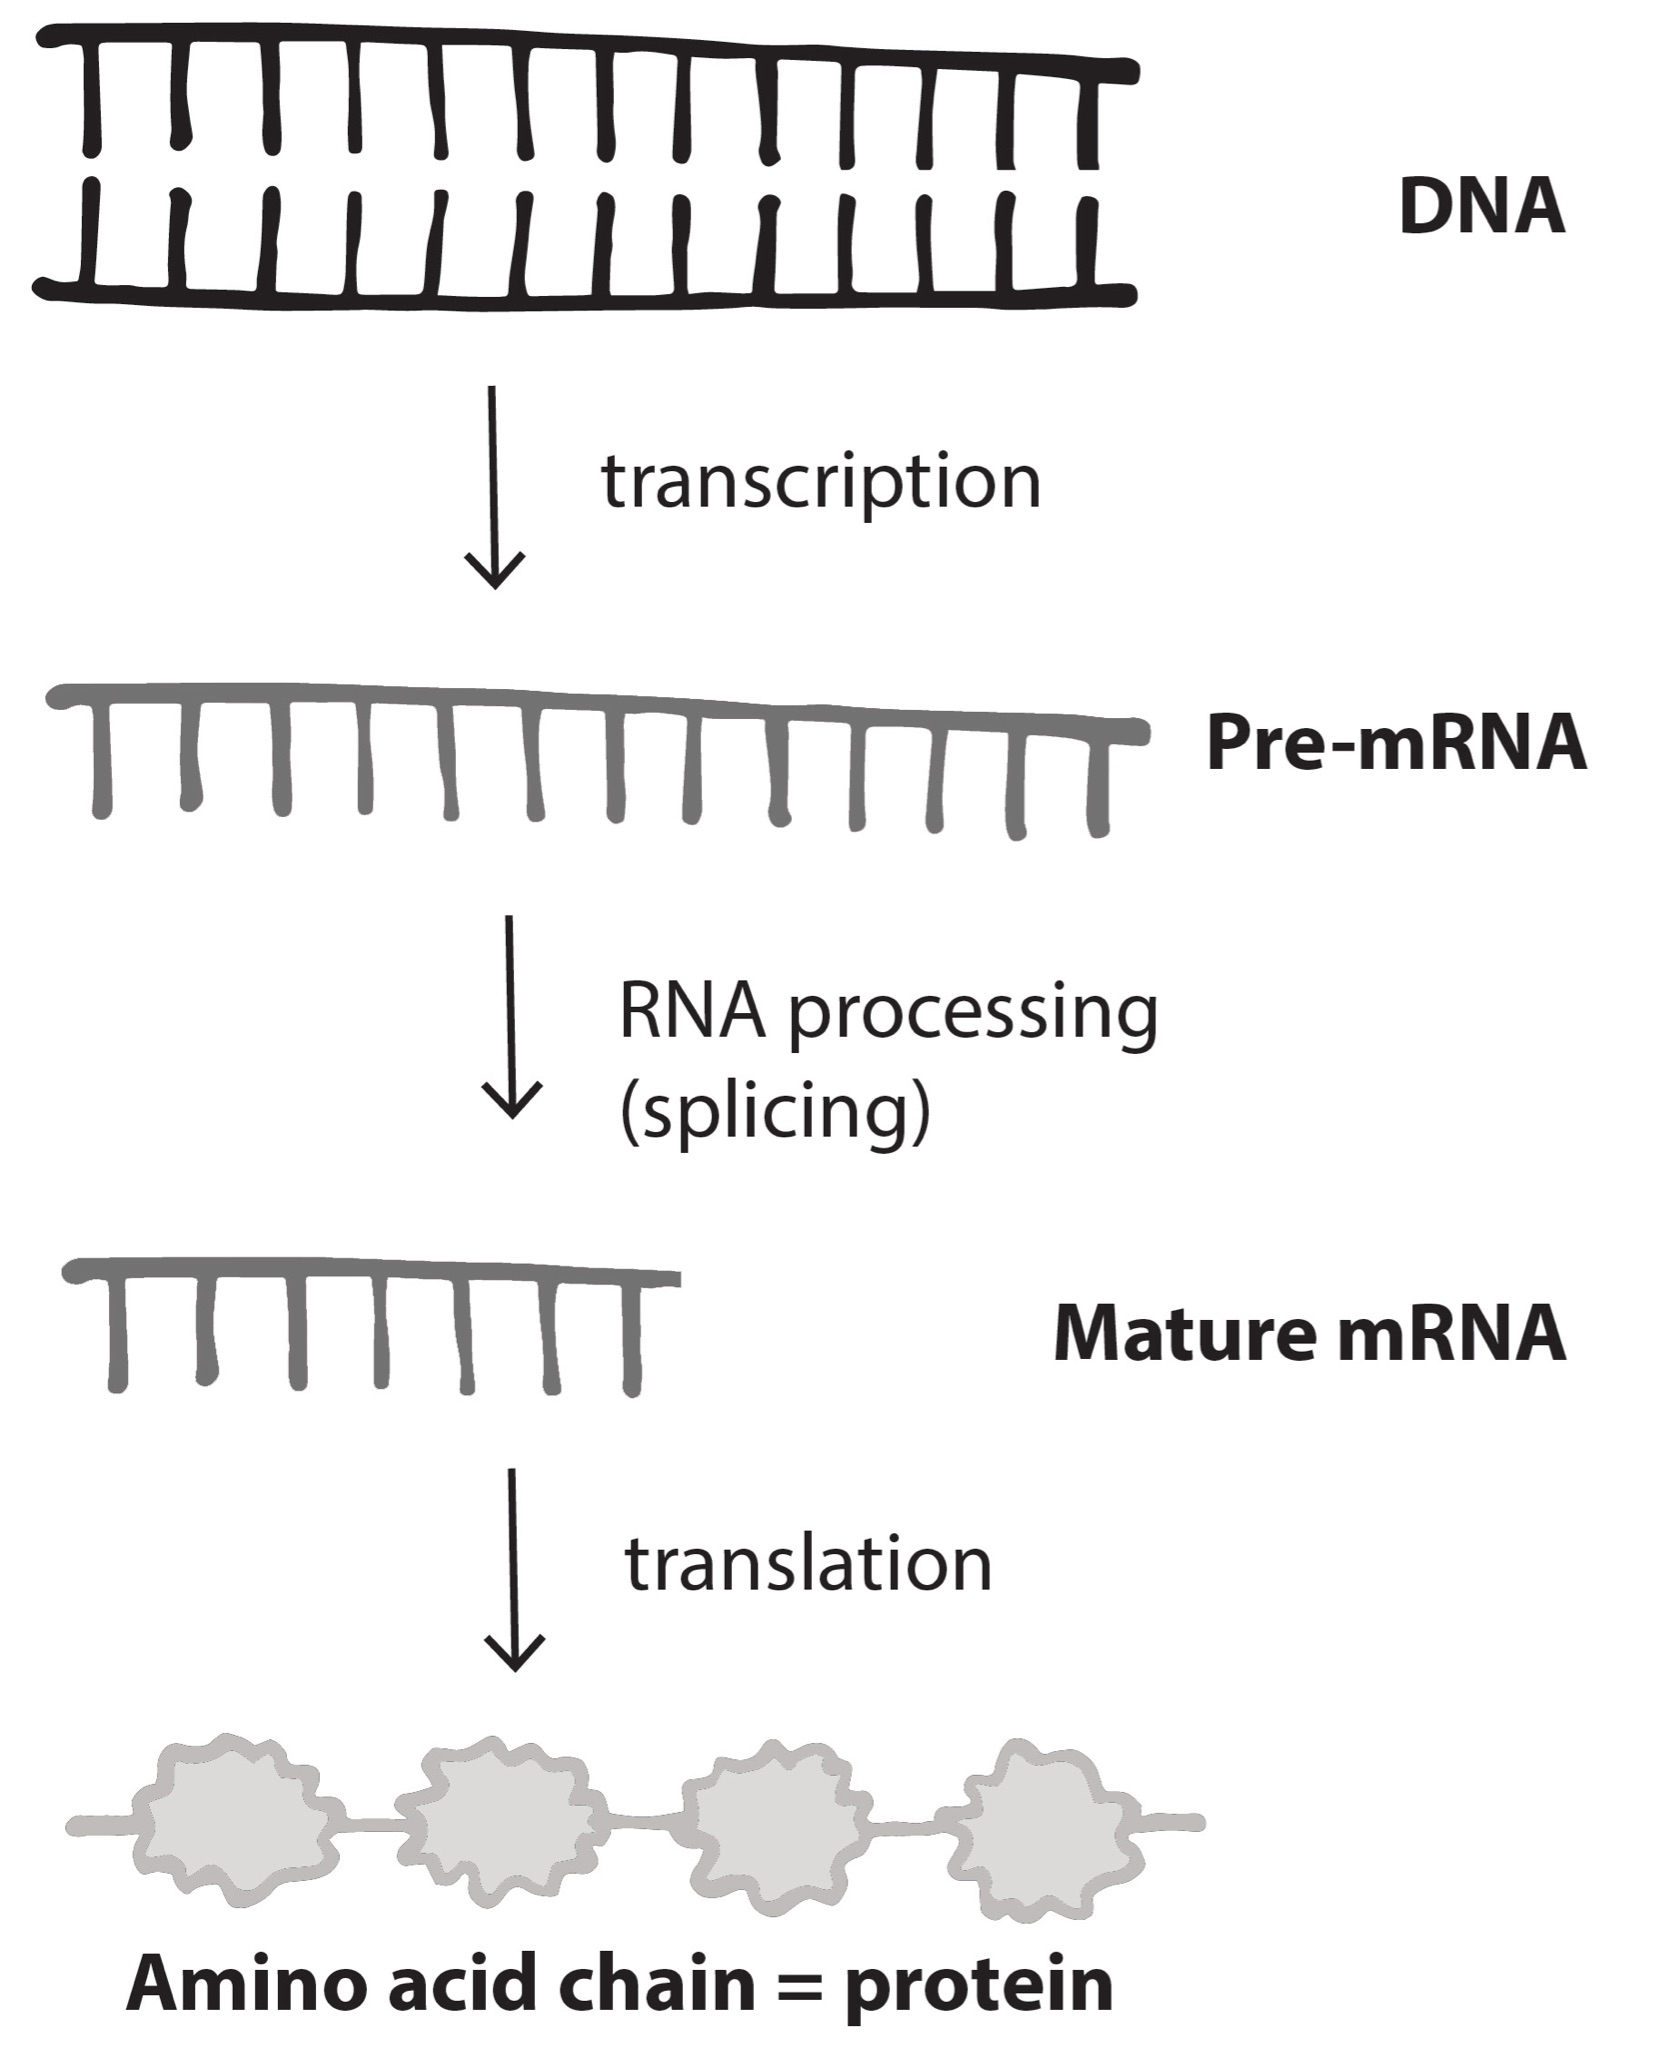
Nucleotides in our DNA provide the coding instructions on how to make proteins. Making proteins, also known as protein synthesis, can be broken down into two main steps referred to as transcription and translation. The purpose of transcription, the first step, is to make an ribonucleic acid (RNA) copy of our genetic code. Although there are many different types of RNA molecules that have a variety of functions within the cell, we will mainly focus on messenger RNA (mRNA). Transcription concludes with the processing (splicing) of the mRNA. The second step, translation, uses mRNA as the instructions for chaining together amino acids into a new protein molecule (Figure 3.17).
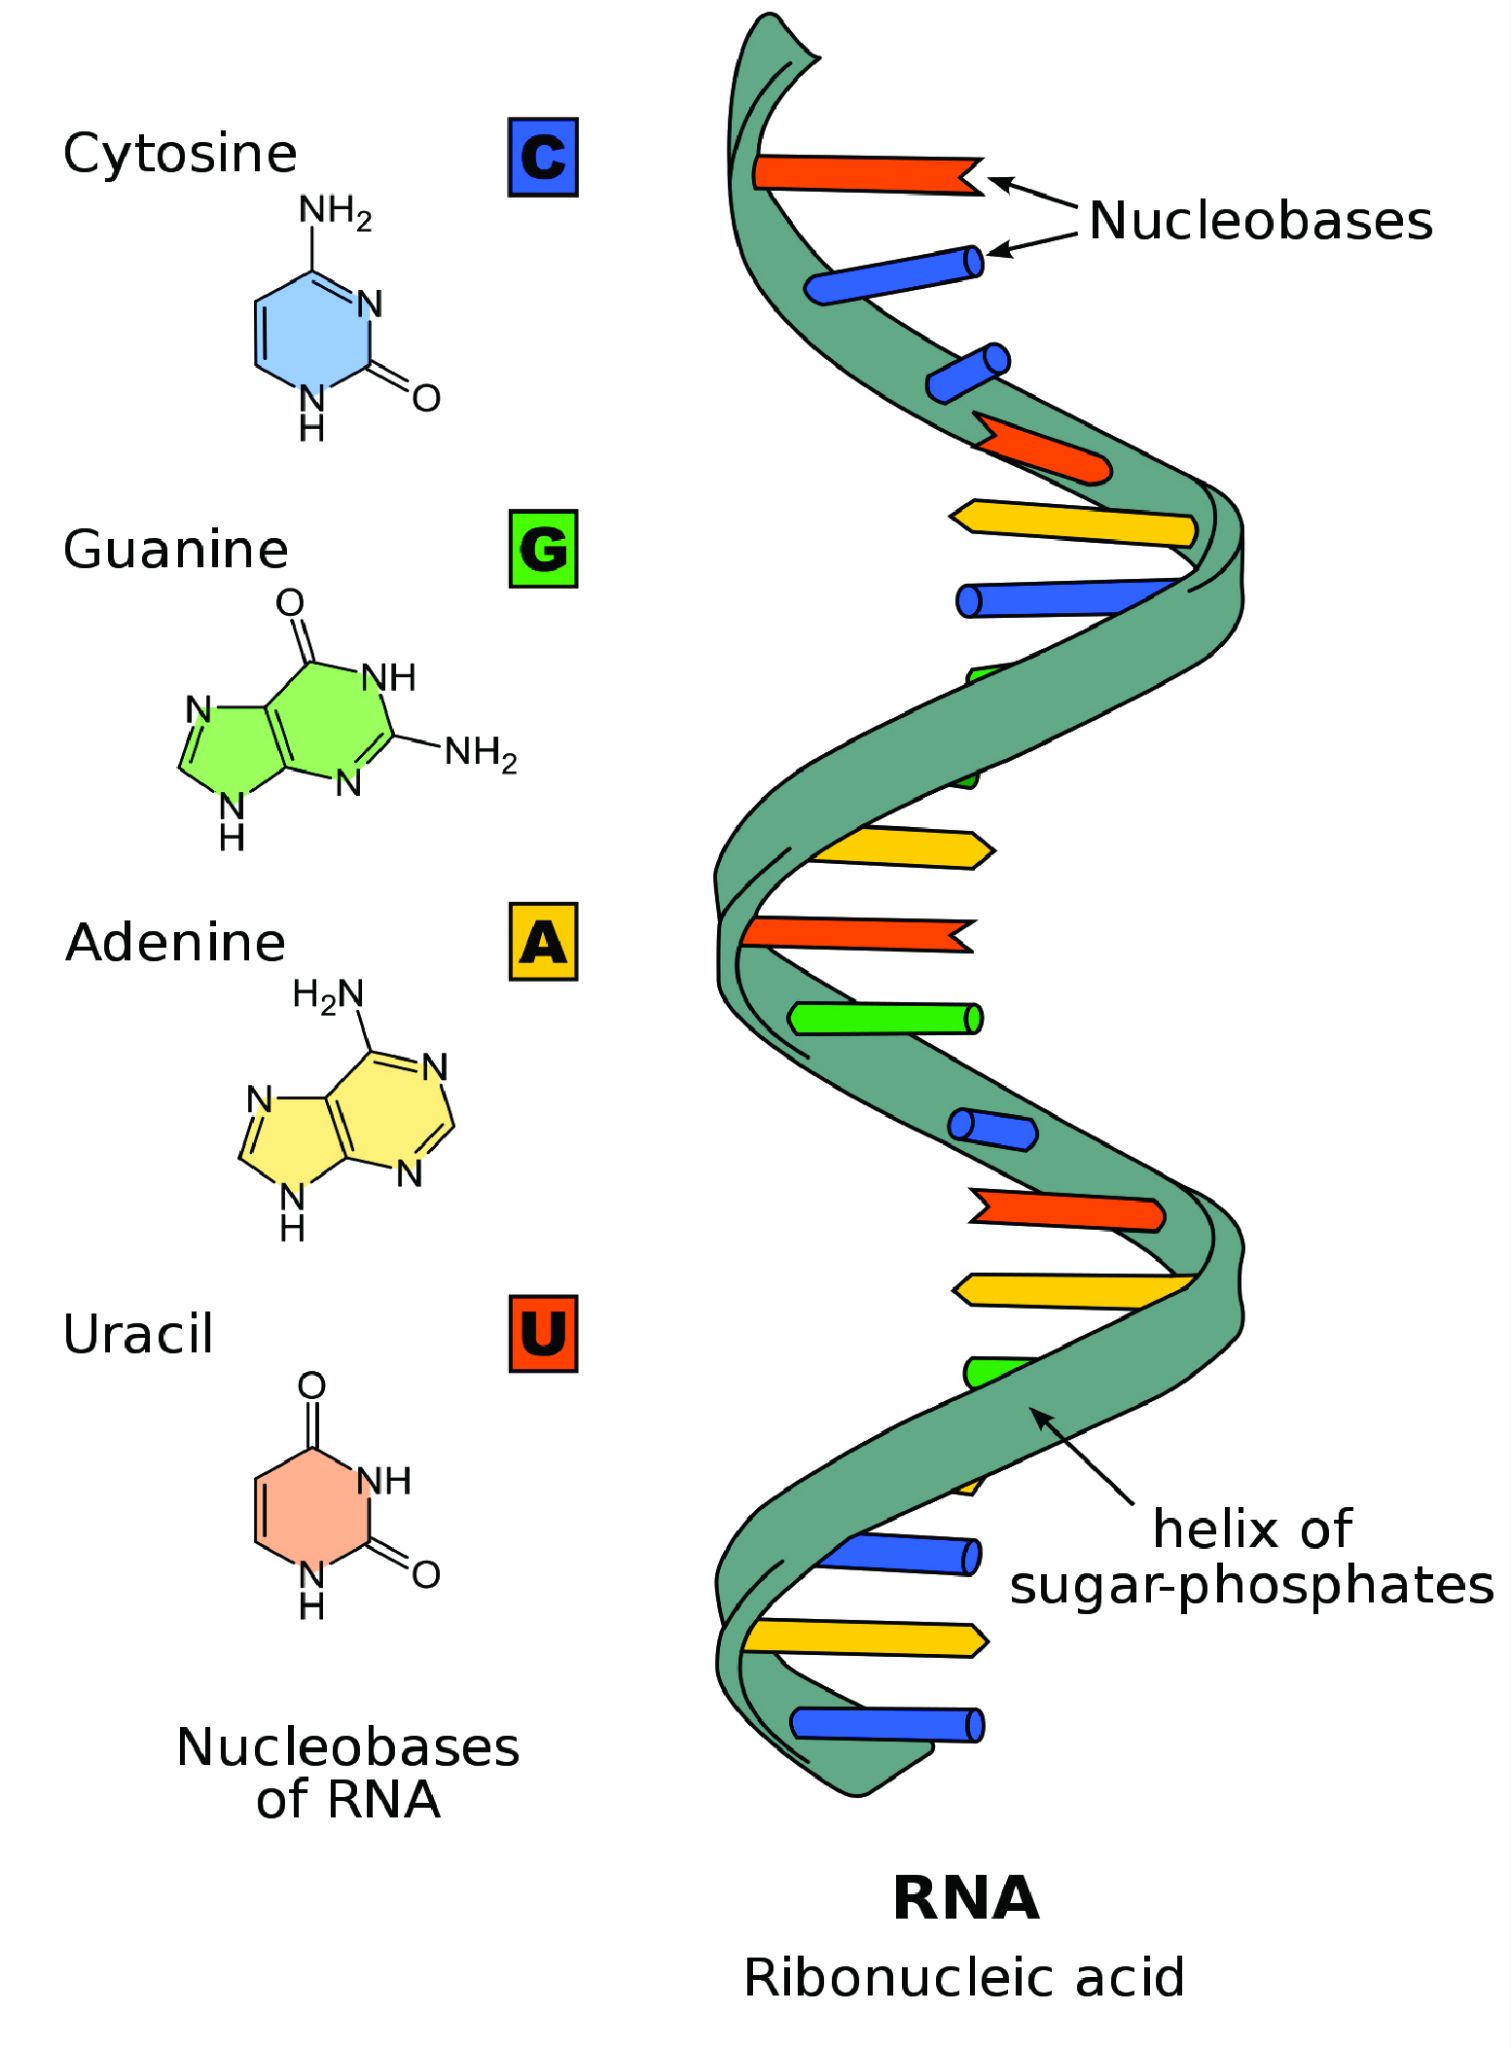
Unlike double-stranded DNA, RNA molecules are single-stranded nucleotide sequences (Figure 3.18). Additionally, while DNA contains the nucleotide thymine (T), RNA does not—instead its fourth nucleotide is uracil (U). Uracil is complementary to (or can pair with) adenine (A), while cytosine (C) and guanine (G) continue to be complementary to each other.
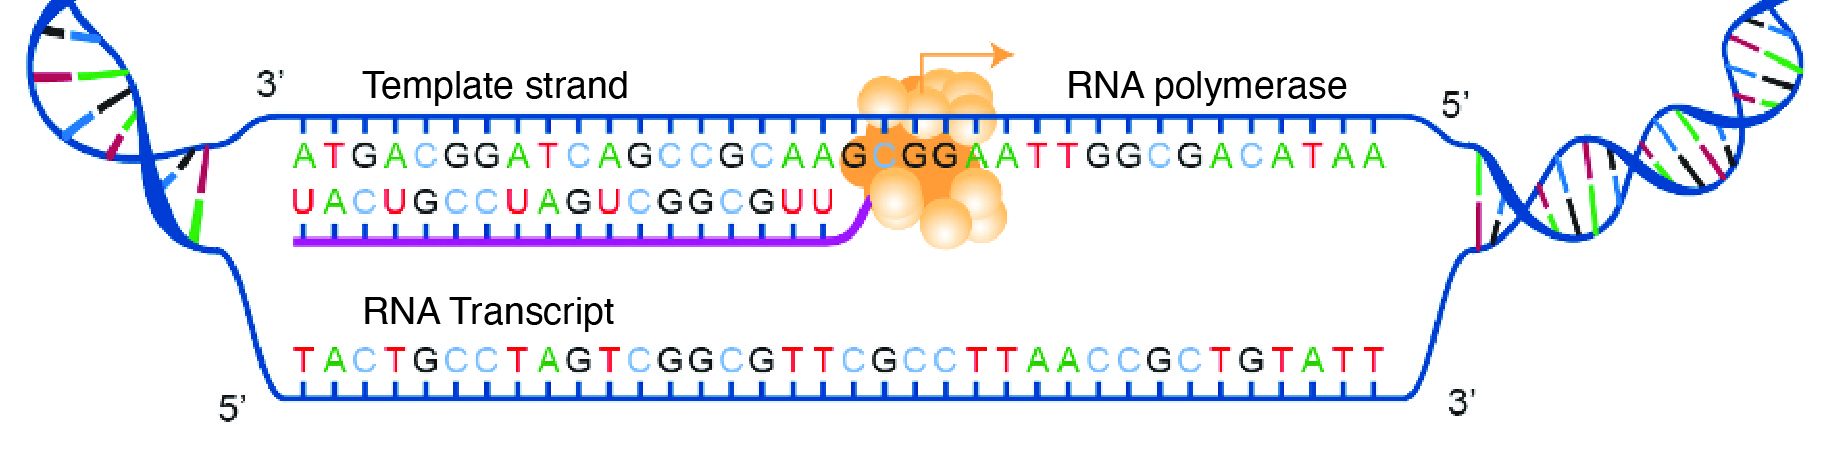
For transcription to proceed, a gene must first be turned “on” by the cell. A gene is a segment of DNA that codes for RNA, and genes can vary in length from a few hundred to as many as two million base pairs in length. The double-stranded DNA is then separated, and one side of the DNA is used as a coding template that is read by RNA polymerase. Next, complementary free-floating RNA nucleotides are linked together (Figure 3.19) to form a single-stranded mRNA. For example, if a DNA template is TACGGATGC, then the newly constructed mRNA sequence will be AUGCCUACG.
Genes contain segments called introns and exons. Exons are considered “coding” while introns are considered “noncoding”—meaning the information they contain will not be needed to construct proteins. When a gene is first transcribed into pre-mRNA, introns and exons are both included (Figure 3.20). However, once transcription is finished, introns are removed in a process called splicing. During splicing, a protein/RNA complex attaches itself to the pre-mRNA. Next, introns are removed and the remaining exons are connected, thus creating a shorter mature mRNA that serves as a template for building proteins.

As described above, the result of transcription is a single-stranded mRNA copy of a gene. Translation is the process by which amino acids are chained together to form a new protein. During translation, the mature mRNA is transported outside of the nucleus, where it is bound to a ribosome (Figure 3.21). The nucleotides in the mRNA are read in triplets, which are called codons. Each mRNA codon corresponds to an amino acid, which is carried to the ribosome by a transfer RNA (tRNA). Thus, tRNAs is the link between the mRNA molecule and the growing amino acid chain.
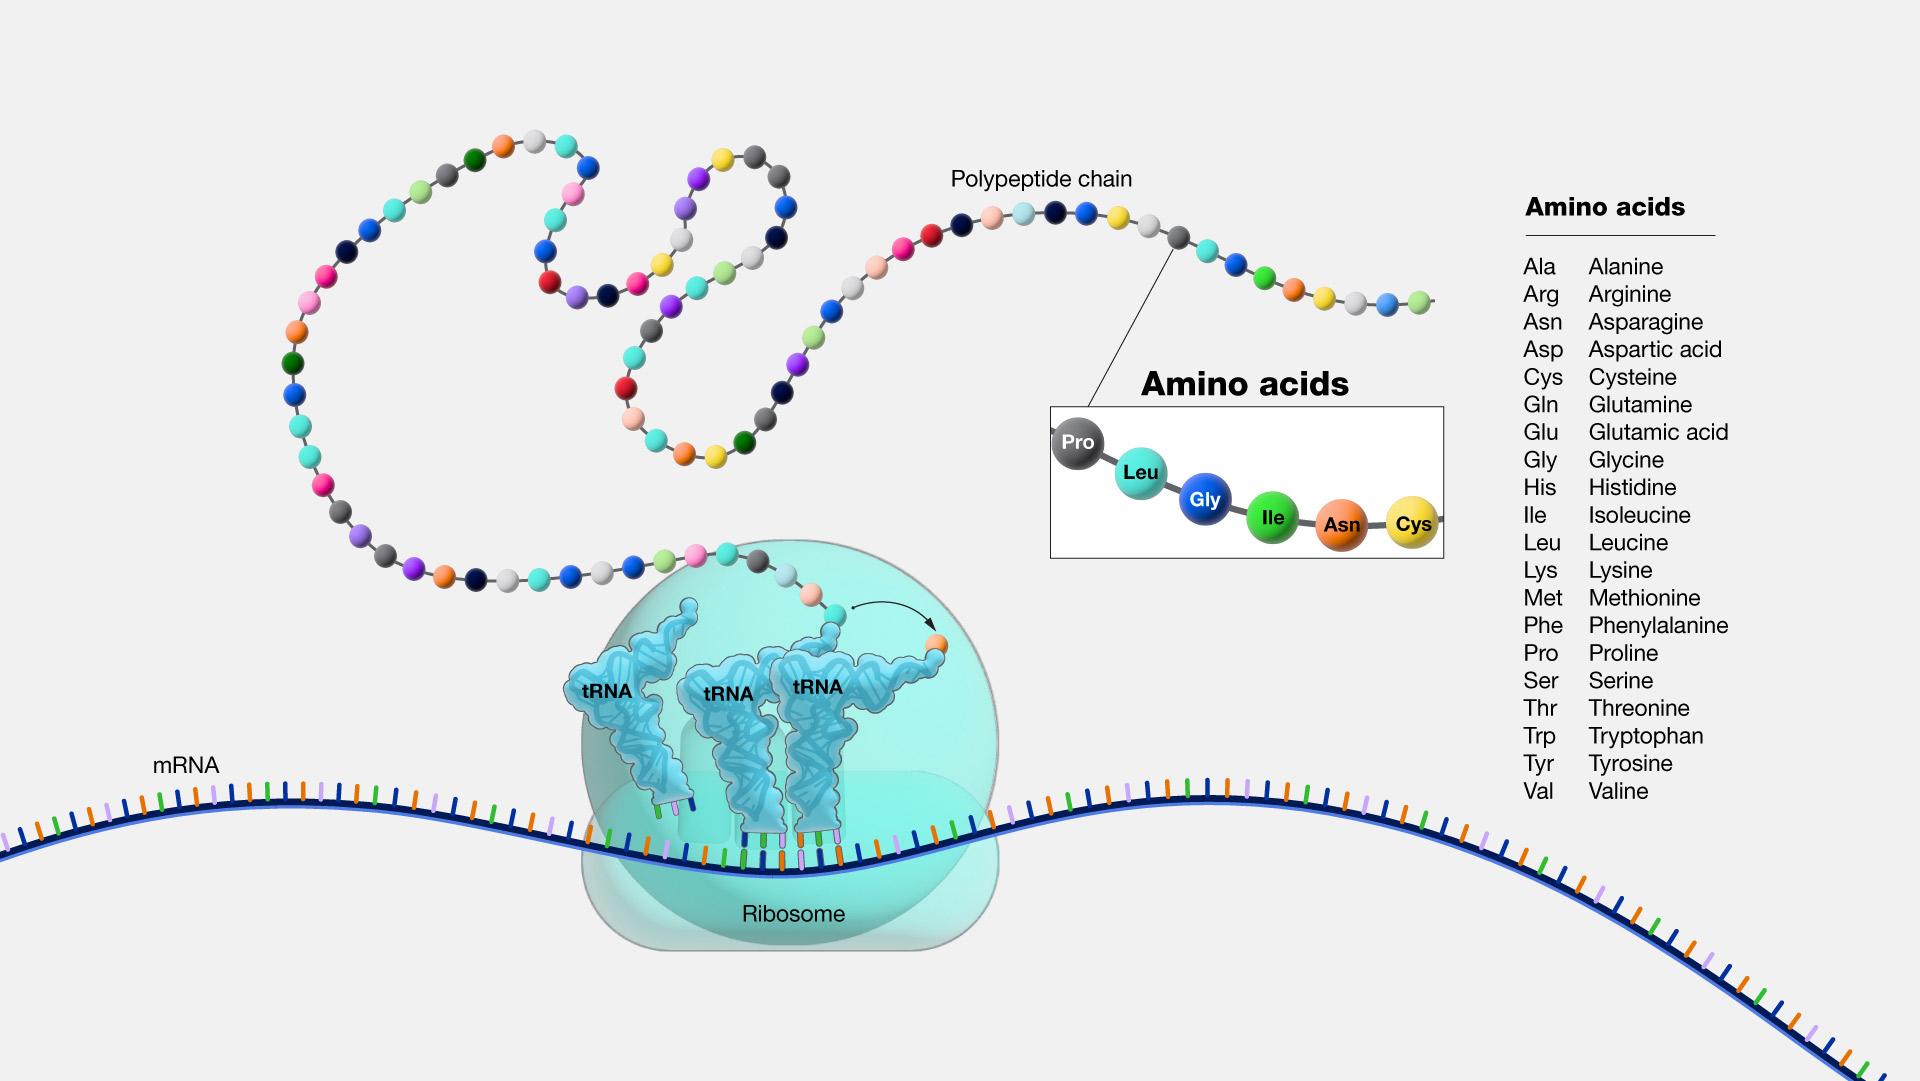
Continuing with our mRNA sequence example from above, the mRNA sequence AUG-CCU-ACG codes for three amino acids. Using a codon table (Figure 3.22), AUG is a codon for methionine (Met), CCU is proline (Pro), and ACG is threonine (Thr). Therefore, the protein sequence is Met-Pro-Thr. Methionine is the most common “start codon” (AUG) for the initiation of protein translation in eukaryotes. As the ribosome moves along the mRNA, the growing amino acid chain exits the ribosome and folds into a protein. When the ribosome reaches a “stop” codon (UAA, UAG, or UGA), the ribosome stops adding any new amino acids, detaches from the mRNA, and the protein is released. Depending upon the amino acid sequence, a linear protein may undergo additional “folding.” The final three-dimensional protein shape is integral to completing a specific structural or functional task.
Dig Deeper: Protein Synthesis
To see protein synthesis in animation, please check out the From DNA to Protein video on YourGenome.org.

Special Topic: Genetic Regulation of the Lactase (LCT) Gene
The LCT gene codes for a protein called lactase, an enzyme produced in the small intestine. It is responsible for breaking down the sugar “lactose,” which is found in milk. Lactose intolerance occurs when not enough lactase enzyme is produced and, in turn, digestive symptoms occur. To avoid this discomfort, individuals may take lactase supplements, drink lactose-free milk, or avoid milk products altogether.
The LCT gene is a good example of how cells regulate protein synthesis. The promoter region of the LCT gene helps regulate whether it is transcribed or not transcribed (i.e., turned “on” or “off,” respectively). Lactase production is initiated when a regulatory protein known as a transcription factor binds to a site on the LCT promoter. RNA polymerases are then recruited; they read DNA and string together nucleotides to make RNA molecules. An LCT pre-mRNA is synthesized (made) in the nucleus, and further chemical modifications flank the ends of the mRNA to ensure the molecule will not be degraded in the cell. Next, a spliceosome complex removes the introns from the LCT pre-mRNA and connects the exons to form a mature mRNA. Translation of the LCT mRNA occurs and the growing protein then folds into the lactase enzyme, which can break down lactose.
Most animals lose their ability to digest milk as they mature due to the decreasing transcriptional “silence” of the LCT gene over time. However, some humans have the ability to digest lactose into adulthood (also known as “lactase persistence”). This means they have a genetic mutation that leads to continuous transcriptional activity of LCT. Lactase persistence mutations are common in populations with a long history of pastoral farming, such as northern European and North African populations. It is believed that lactase persistence evolved because the ability to digest milk was nutritionally beneficial. More information about lactase persistence will be covered in Chapter 14.
Mendelian Genetics
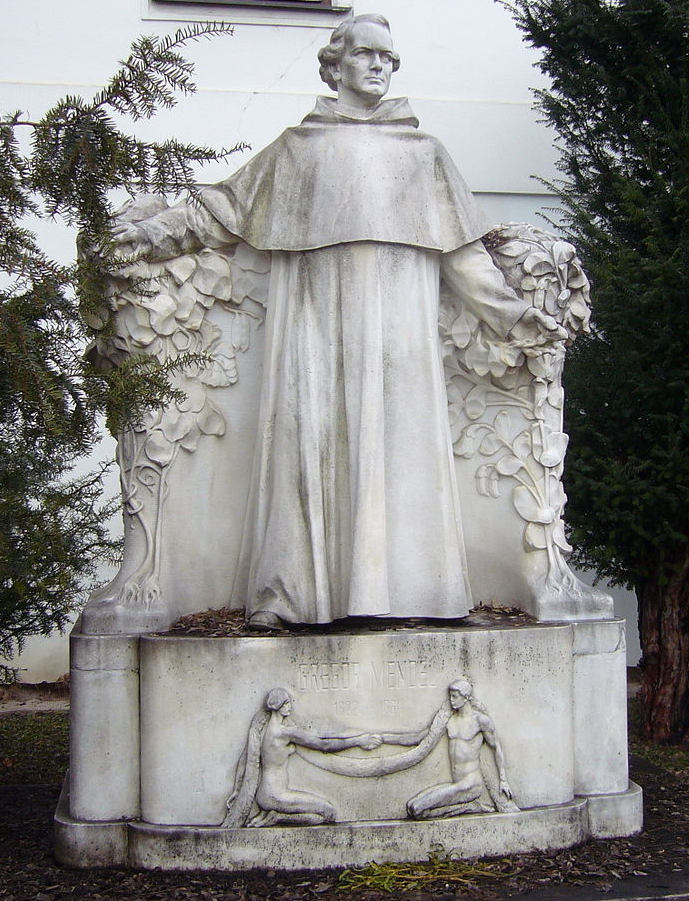
Gregor Johann Mendel (1822–1884) is often described as the “Father of Genetics.” Mendel was a monk who conducted pea plant breeding experiments in a monastery located in the present-day Czech Republic (Figure 3.23). After several years of experiments, Mendel presented his work to a local scientific community in 1865 and published his findings the following year. Although his meticulous effort was notable, the importance of his work was not recognized for another 35 years. One reason for this delay in recognition is that his findings did not agree with the predominant scientific viewpoints on inheritance at the time. For example, it was believed that parental physical traits “blended” together and offspring inherited an intermediate form of that trait. In contrast, Mendel showed that certain pea plant physical traits (e.g., flower color) were passed down separately to the next generation in a statistically predictable manner. Mendel also observed that some parental traits disappeared in offspring but then reappeared in later generations. He explained this occurrence by introducing the concept of “dominant” and “recessive” traits. Mendel established a few fundamental laws of inheritance, and this section reviews some of these concepts. Moreover, the study of traits and diseases that are controlled by a single gene is commonly referred to as Mendelian genetics.
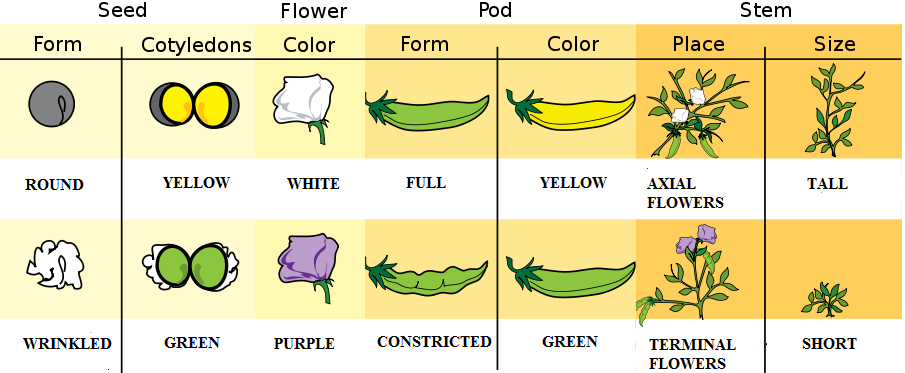
The physical appearance of a trait is called an organism’s phenotype. Figure 3.24 shows pea plant (Pisum sativum) phenotypes that were studied by Mendel, and in each of these cases the physical traits are controlled by a single gene. In the case of Mendelian genetics, a phenotype is determined by an organism’s genotype. A genotype consists of two gene copies, wherein one copy was inherited from each parent. Gene copies are also known as alleles (Figure 3.25), which means they are found in the same gene location on homologous chromosomes. Alleles have a nonidentical DNA sequence, which means their phenotypic effect can be different. In other words, although alleles code for the same trait, different phenotypes can be produced depending on which two alleles (i.e., genotypes) an organism possesses. For example, Mendel’s pea plants all have flowers, but their flower color can be purple or white. Flower color is therefore dependent upon which two color alleles are present in a genotype.
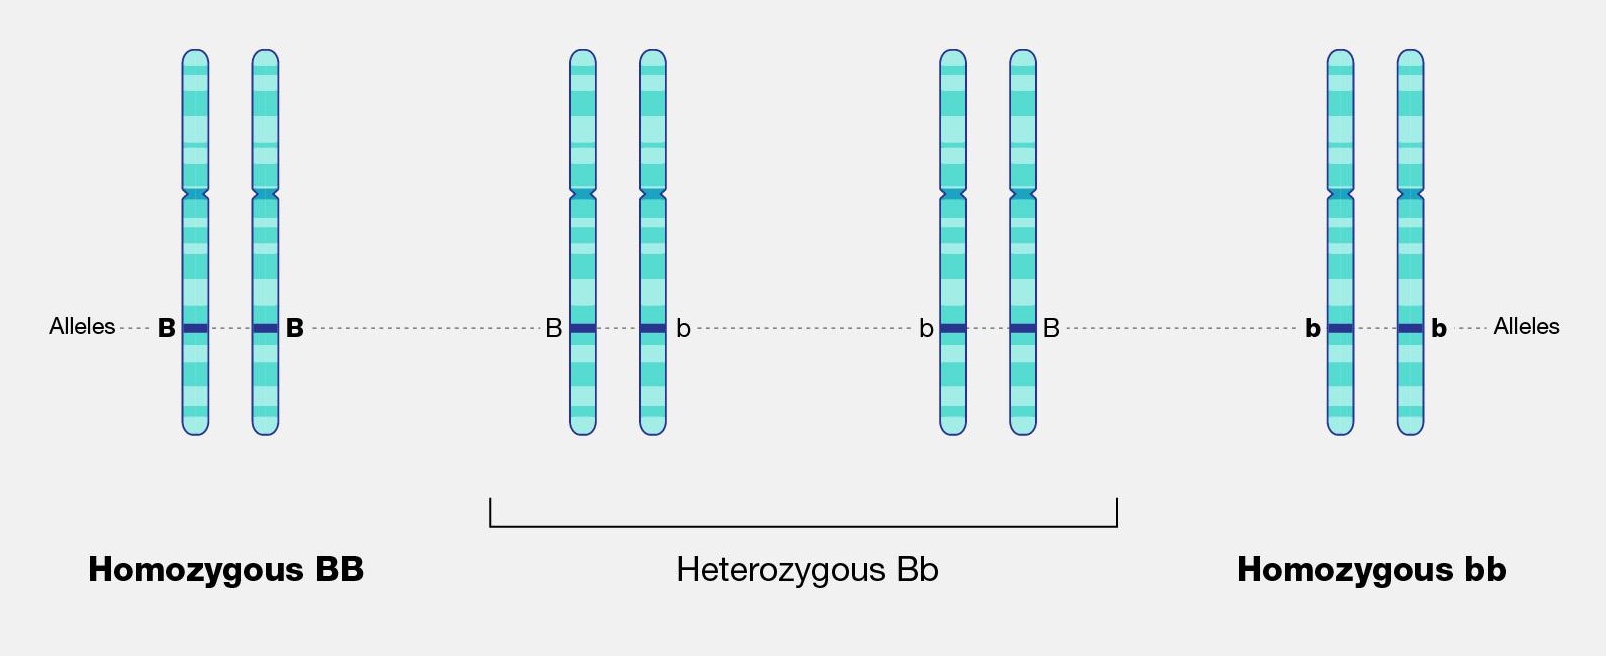
A Punnett square is a diagram that can help visualize Mendelian inheritance patterns. For instance, when parents of known genotypes mate, a Punnett square can help predict the ratio of Mendelian genotypes and phenotypes that their offspring would possess. When discussing genotype, biologists use upper and lower case letters to denote the different allele copies. Figure 3.26 is a Punnett square that includes two heterozygous parents for flower color (Bb). A heterozygous genotype means there are two different alleles for the same gene. Therefore, a pea plant that is heterozygous for flower color has one purple allele and one white allele. When an organism is homozygous for a specific trait, it means their genotype consists of two copies of the same allele. Using the Punnett square example, the two heterozygous pea plant parents can produce offspring with two different homozygous genotypes (BB or bb) or offspring that are heterozygous (Bb).
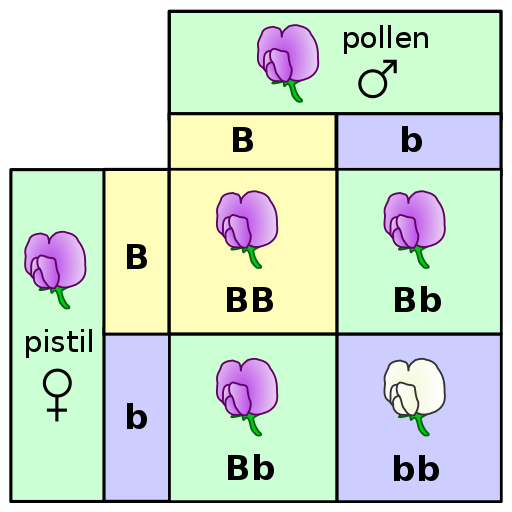
A pea plant with purple flowers could be heterozygous (Bb) or homozygous (BB). This is because the purple color allele (B) is dominant to the white color allele (b), and therefore it only needs one copy of that allele to phenotypically express purple flowers. Because the white flower allele is recessive, a pea plant must be homozygous for the recessive allele in order to have a white color phenotype (bb). As seen by the Punnett square example (Figure 3.26), three of four offspring will have purple flowers and the other one will have white flowers.
The Law of Segregation was introduced by Mendel to explain why we can predict the ratio of genotypes and phenotypes in offspring. As discussed previously, a parent will have two alleles for a certain gene (with each copy on a different homologous chromosome). The Law of Segregation states that the two copies will be segregated from each other and will each be distributed to their own gamete. We now know that the process where that occurs is meiosis.
Offspring are the products of two gametes combining, which means the offspring inherits one allele from each gamete for most genes. When multiple offspring are produced (like with pea plant breeding), the predicted phenotype ratios are more clearly observed. The pea plants Mendel studied provide a simplistic model to understand single-gene genetics. While many traits anthropologists are interested in have a more complicated inheritance (e.g., are informed by many genes), there are a few known Mendelian traits in humans. Additionally, some human diseases also follow a Mendelian pattern of inheritance (Figure 3.27). Because humans do not have as many offspring as other organisms, we may not recognize Mendelian patterns as easily. However, understanding these principles and being able to calculate the probability that an offspring will have a Mendelian phenotype is still important.
| Mendelian disorder | Gene |
|---|---|
| Alpha Thalassemia | HBA1 |
| Cystic Fibrosis | CFTR |
| Fragile X Syndrome | FMR1 |
| Glucose-6-Phosphate Dehydrogenase Deficiency | G6PD |
| Hemophilia A | F8 |
| Huntington disease | HTT |
| Mitochondrial DNA Depletion Syndrome | TYMP |
| Oculocutaneous Albinism: Type 1 | TYR |
| Polycystic Kidney Disease | PKHD1 |
| Sickle-cell anemia | HBB |
| Spinal Muscular Atrophy: SMN1 Linked | SMN1 |
| Tay-Sachs Disease | HEXA |
| Wilson Disease | ATP7B |
Example of Mendelian Inheritance: The ABO Blood Group System
In 1901, Karl Landsteiner at the University of Vienna published his discovery of ABO blood groups. While conducting blood immunology experiments in which he combined the blood of individuals who possess different blood cell types, he observed an agglutination (clotting) reaction. The presence of agglutination implies there is an incompatible immunological reaction; no agglutination will occur in individuals with the same blood type. This work was clearly important because it resulted in a higher survival rate of patients who received blood transfusions. Blood transfusions from someone with a different type of blood causes agglutinations, and the resulting coagulated blood can not easily pass through blood vessels, resulting in death. Landsteiner received the Nobel Prize (1930) for his discovery and explaination of the ABO blood group system.
Blood cell surface antigens are proteins that coat the surface of red blood cells, and antibodies are specifically “against” or “anti” to the antigens from other blood types. Thus, antibodies are responsible for causing agglutination between incompatible blood types. Understanding the interaction of antigens and antibodies helps to determine ABO compatibility amongst blood donors and recipients. To better comprehend blood phenotypes and ABO compatibility, blood cell antigens and plasma antibodies are presented in Figure 3.28. Individuals that are blood type A have A antigens on the red blood cell surface, and anti-B antibodies, which will bind to B antigens should they come in contact. Alternatively, individuals with blood type B have B antigens and anti-A antibodies. Individuals with blood type AB have both A and B antigens but do not produce antibodies for the ABO system. This does not mean type AB does not have any antibodies present, just that specifically anti-A and anti-B antibodies are not produced. Individuals who are blood type O have nonspecific antigens and produce both anti-A and anti-B antibodies.
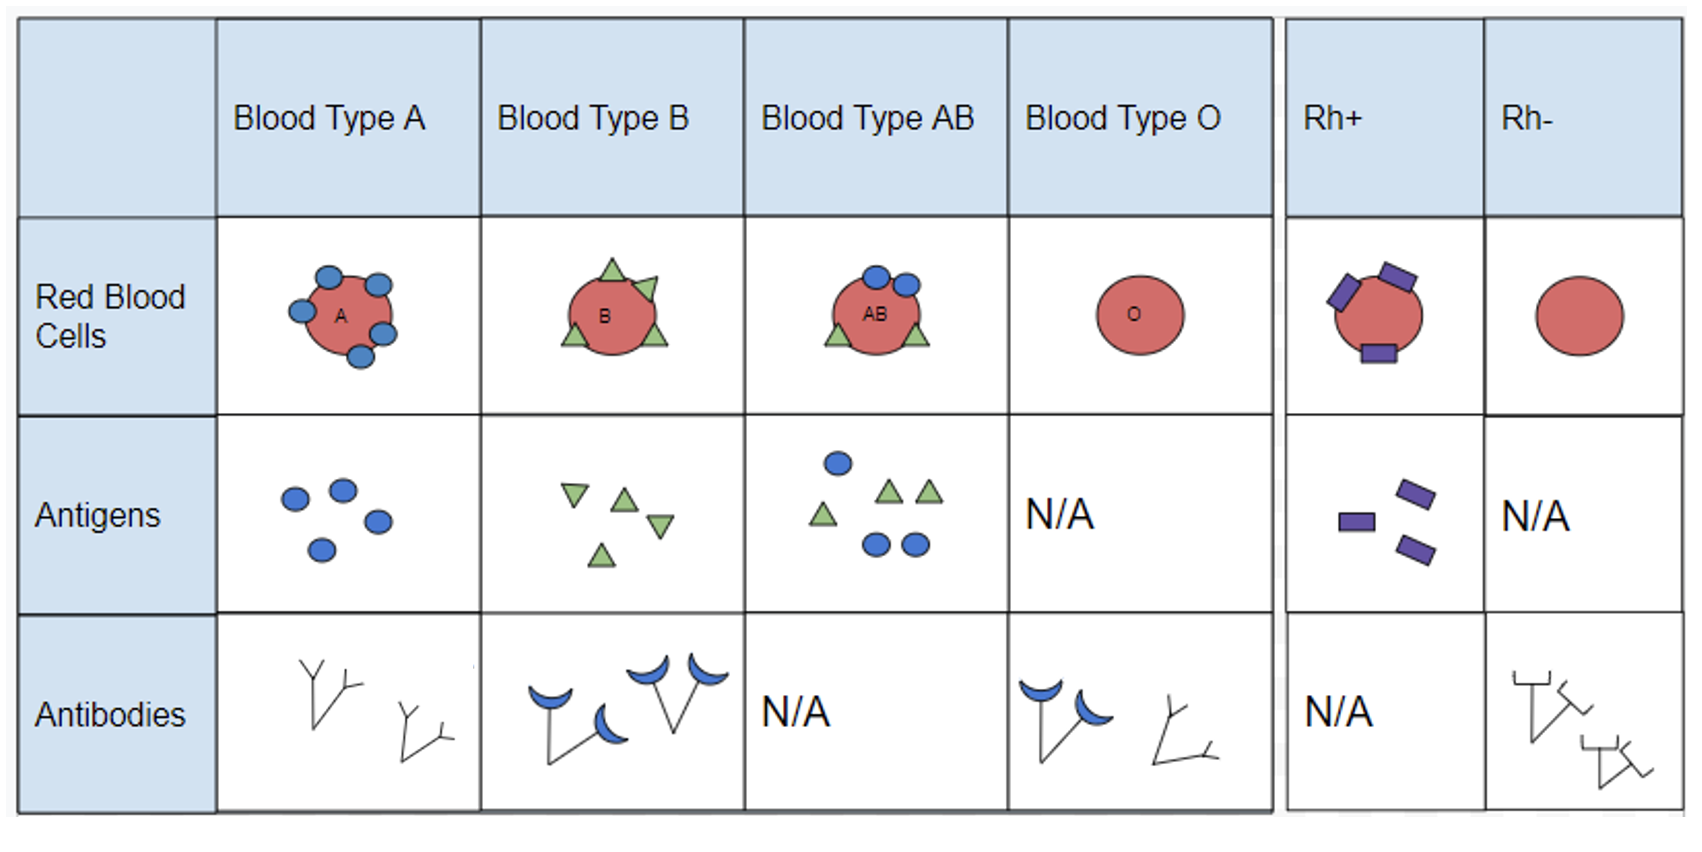
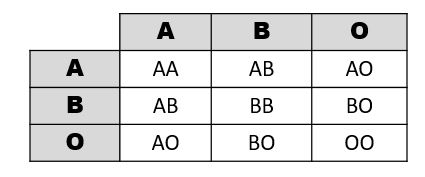
Figure 3.29 shows a table of the ABO allele system, which has a Mendelian pattern of inheritance. Both the A and B alleles function as dominant alleles, so the A allele always codes for the A antigen, and the B allele codes for the B antigen. The O allele differs from A and B, because it codes for a nonfunctional antigen protein, which means there is no antigen present on the cell surface of O blood cells. To have blood type O, two copies of the O allele must be inherited, one from each parent, thus the O allele is considered recessive. Therefore, someone who is a heterozygous AO genotype is phenotypically blood type A, and a genotype of BO is blood type B. The ABO blood system also provides an example of codominance, which is when both alleles are observed in the phenotype. This is true for blood type AB: when an individual inherits both the A and B alleles, then both A and B antigens will be present on the cell surface.
Also found on the surface of red blood cells is the rhesus group antigen, known as “Rh factor.” In reality, there are several antigens on red blood cells independent from the ABO blood system, however, the Rh factor is the second most important antigen to consider when determining blood donor and recipient compatibility. Rh antigens must also be considered when a pregnant mother and her baby have incompatible Rh factors. In such cases, a doctor can administer necessary treatment steps to prevent pregnancy complications and hemolytic disease, which is when the mother’s antibodies break down the newborn’s red blood cells.
An individual can possess the Rh antigen (be Rh positive) or lack the Rh antigen (be Rh negative). The Rh factor is controlled by a single gene and is inherited independently of the ABO alleles. Therefore, all blood types can either be positive (O+, A+, B+, AB+) or negative (O-, A-, B-, AB-).
Individuals with O+ red blood cells can donate blood to A+, B+, AB+, and O+ blood type recipients. Because O- individuals do not have AB or Rh antigens, they are compatible with all blood cell types and are referred to as “universal donors.” Individuals that are AB+ are considered to be “universal recipients” because they do not possess antibodies against other blood types.
Mendelian Patterns of Inheritance and Pedigrees
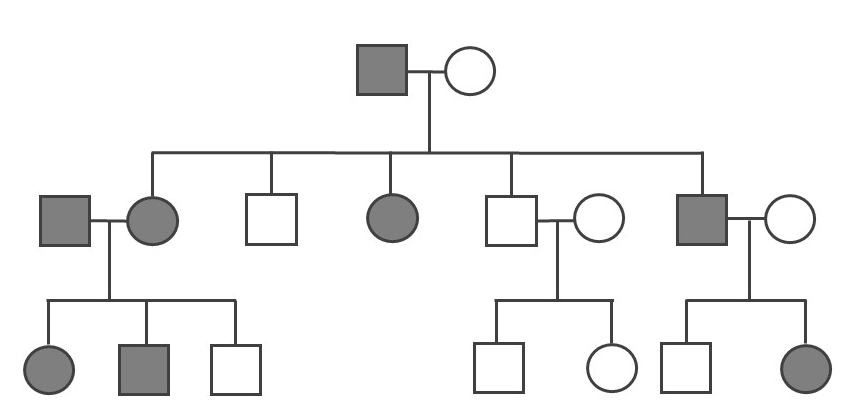
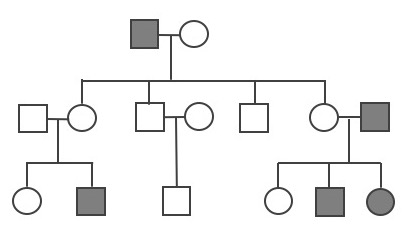
A pedigree can be used to investigate a family’s medical history by determining if a health issue is inheritable and will possibly require medical intervention. A pedigree can also help determine if it is a Mendelian recessive or dominant genetic condition. Figure 3.30 is a pedigree example of a family with Huntington’s disease, which has a Mendelian dominant pattern of inheritance. In a standard pedigree, males are represented by a square and females are represented by a circle. Biological family members are connected to a horizontal line, with biological parents above and offspring below. When an individual is affected with a certain condition, the square or circle is filled in as a solid color. With a dominant condition, at least one of the parents will have the disease and an offspring will have a 50% chance of inheriting the affected chromosome. Therefore, dominant genetic conditions tend to be present in every generation. In the case of Huntington’s, some individuals may not be diagnosed until later in adulthood, so parents may unknowingly pass this dominantly inherited disease to their children.
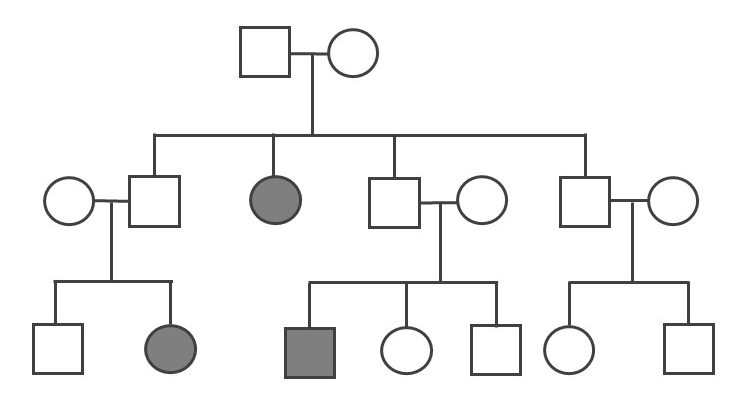
Because the probability of inheriting a disease-causing recessive allele is more rare, recessive medical conditions can skip generations. Figure 3.31 is an example of a family that carries a recessive cystic fibrosis mutation. A parent that is heterozygous for the cystic fibrosis allele has a 50% chance of passing down their affected chromosome to the next generation. If a child has a recessive disease, then it means both of their parents are carriers (heterozygous) for that condition. In most cases, carriers for recessive conditions show no serious medical symptoms. Individuals whose family have a known medical history for certain conditions sometimes seek family planning services (see the Genetic Testing section).
Pedigrees can also help distinguish if a health issue has either an autosomal or X-linked pattern of inheritance. As previously discussed, there are 23 pairs of chromosomes and 22 of these pairs are known as autosomes. The provided pedigree examples (Figure 3.30–31) are autosomally linked genetic diseases. This means the genes that cause the disease are on one of the chromosomes numbered 1 to 22. The conditions caused by genes located on the X chromosome are referred to as X-linked diseases.
Figure 3.32 depicts a family in which the mother is a carrier for the X-linked recessive disease Duchenne Muscular Dystrophy (DMD). The mother is a carrier for DMD, so daughters and sons will have a 50% chance of inheriting the pathogenic DMD allele. Because females have two X chromosomes, females who inherit only one copy will not have the disease (although in rare cases, female carriers may show some symptoms of the disease). On the other hand, males who inherit a copy of an X-linked pathogenic DMD allele will typically be affected with the condition. Thus, males are more susceptible to X-linked conditions because they only have one X chromosome. Therefore, when evaluating a pedigree, if a higher proportion of males are affected with the disease, this could suggest the disease is X-linked recessive.
Compared to the X chromosome, the Y chromosome is smaller with only a few genes. Y-linked traits are therefore rare and can only be passed from a chromosomal father to a biological XY child.
Other Patterns of Inheritance
Complexity Surrounding Mendelian Inheritance
Pea plant trait genetics are relatively simple compared to what we know about genetic inheritance today. The vast majority of genetically controlled traits are not strictly dominant or recessive, so the relationship among alleles and predicting phenotype is often more complicated. For example, traits that exhibit incomplete dominance occur when a heterozygote exhibits a phenotype that is an intermediate phenotype of both alleles. In snapdragon flowers, the red flower color (R) is dominant and white is recessive (r). Therefore, the homozygous dominant RR is red and homozygous recessive rr is white. However, because the R allele is not completely dominant, the heterozygote Rr is a blend of red and white, which results in a pink flower (Figure 3.33).

An example of incomplete dominance in humans is the enzyme β-hexosaminidase A (Hex A), which is encoded by the gene HEXA. Patients with two dysfunctional HEXA alleles are unable to metabolize a specific lipid-sugar molecule (GM2 ganglioside); because of this, the molecule builds up and causes damage to nerve cells in the brain and spinal cord. This condition is known as Tay-Sachs disease, and it usually appears in infants who are three to six months old. Most children with Tay-Sachs do not live past early childhood. Individuals who are heterozygous for the functional type HEXA allele and one dysfunctional allele have reduced Hex A activity. However, the amount of enzyme activity is still sufficient, so carriers do not exhibit any neurological phenotypes and appear healthy.
Some genes and alleles can also have higher penetrance than others. Penetrance can be defined as the proportion of individuals who have a certain allele and also express an expected phenotype. If a genotype always produces an expected phenotype, then those alleles are said to be fully penetrant. However, in the case of incomplete (or reduced) penetrance, an expected phenotype may not occur even if an individual possesses the alleles that are known to control a trait or cause a disease.
A well-studied example of genetic penetrance is the cancer-related genes BRCA1 and BRCA2. Mutations in these genes can affect crucial processes such as DNA repair, which can lead to breast and ovarian cancers. Although BRCA1 and BRCA2 mutations have an autosomal dominant pattern of inheritance, it does not mean an individual will develop cancer if they inherit a pathogenic allele. Several lifestyle and environmental factors can also influence the risk for developing cancer. Regardless, if a family has a history of certain types of cancers, then it is often recommended that genetic testing be performed for individuals who are at risk. Moreover, publically available genetic testing companies are now offering health reports that include BRCA1 and BRCA2 allele testing (see the Genetic Testing section).
Polygenic Traits
While Mendelian traits tend to be influenced by a single gene, the vast majority of human phenotypes are polygenic traits. The term polygenic means “many genes.” Therefore, a polygenic trait is influenced by many genes that work together to produce the phenotype. Human phenotypes such as hair color, eye color, height, and weight are examples of polygenic traits. Hair color, for example, is largely determined by the type and quantity of a pigment called melanin, which is produced by a specialized cell type within the skin called melanocytes.The quantity and ratio of melanin pigments determine black, brown, blond, and red hair colors. MC1R is a well-studied gene that encodes a protein expressed on the surface of melanocytes that is involved in the production of eumelanin pigment. Typically, people with two functional copies of MC1R have brown hair. People with reduced functioning MC1R allele copies tend to produce pheomelanin, which results in blond or red hair. However, MC1R alleles have variable penetrance, and studies are continually identifying new genes (e.g., TYR, TYRP1, SLC24A5, and KITLG) that also influence hair color. Individuals with two nonfunctioning copies of the gene TYR have a condition called oculocutaneous albinism—their melanocytes are unable to produce melanin so these individuals have white hair, light eyes, and pale skin.
In comparison to Mendelian diseases, complex diseases (e.g., Type II diabetes, coronary heart disease, Alzheimer’s, and schizophrenia) are more prevalent in humans. Complex diseases are polygenic, but their development is also influenced by physical, environmental, sociocultural, and individual lifestyle factors. Families can be more predisposed to certain diseases; however, complex diseases often do not have a clear pattern of inheritance.
Although research of complex traits and diseases continue, geneticists may not know all of the genes involved with a given complex disease. Additionally, how much genetic versus nongenetic determinants contribute to a disease phenotype can be difficult to decipher. Therefore, predicting individual medical risk and risk across different human populations is often a significant challenge. For instance, cardiovascular diseases (CVDs) continue to be one of the leading causes of death around the world. Development of CVDs has been linked to nutrient exposure during fetal development, high fat and sedentary lifestyles, drug usage, adverse socioeconomic conditions, and various genes. Human environments are diverse, and public health research including the field of Human Biology can help identify risk factors and behaviors associated with chronic diseases. Large-scale clinical genetic studies with powerful bioinformatic approaches can also help elucidate some of these complex relationships.
Genomics and Epigenetics
A genome is all of the genetic material of an organism. In the case of humans, this includes 46 chromosomes and mtDNA. The human genome contains approximately three billion base pairs of DNA and has regions that are both noncoding and coding. Scientists now estimate that the human genome contains 20,000–25,000 protein-coding genes, with each chromosome containing a few hundred to a few thousand genes. As our knowledge of heredity increases, researchers have begun to realize the importance of epigenetics, or changes in gene expression that do not result in a change of the underlying DNA sequence. Epigenetics research is also crucial for unraveling gene regulation, which involves complex interactions between DNA, RNA, proteins, and the environment.
Genomics
The vast majority of the human genome is noncoding, meaning there are no instructions to make a protein or RNA product in these regions. Historically, noncoding DNA was referred to as “junk DNA” because these vast segments of the genome were thought to be irrelevant and nonfunctional. However, continual improvement of DNA sequencing technology along with worldwide scientific collaborations and consortia have contributed to our increased understanding of how the genome functions. Through these technological advances and collaborations, we have since discovered that many of these noncoding DNA regions are involved in dynamic genetic regulatory processes.
Genomics is a diverse field of molecular biology that focuses on genomic evolution, structure, and function; gene mapping; and genotyping (determining the alleles present). Evolutionary genomics determined that humans share about 98.8% percent of their DNA with chimpanzees. Given the phenotypic differences between humans and chimpanzees, having a DNA sequence difference of 1.2% seems surprising. However, a lot of genomics research is also focused on understanding how noncoding genomic regions influence how individual genes are turned “on” and “off” (i.e., regulated). Therefore, although DNA sequences are identical, regulatory differences in noncoding genetic regions (e.g., promoters) are believed to be largely responsible for the physical differences between humans and chimpanzees.
Further understanding of genomic regulatory elements can lead to new therapies and personalized treatments for a broad range of diseases. For example, targeting the regulatory region of a pathogenic gene to “turn off” its expression can prevent its otherwise harmful effects. Such molecular targeting approaches can be personalized based on an individual’s genetic makeup. Genome-wide association studies (GWAS), which seek to determine genes that are linked to complex traits and diseases, typically require significant computational efforts. This is because millions of DNA sequences must be analyzed and GWAS sometimes include thousands of participants. During the beginning of the genomics field, most of the large-scale genomics studies only included North American, European, and East Asian participants and patients. Researchers are now focusing on increasing ethnic diversity in genomic studies and databases. In turn, accuracy of individual disease risk across all human populations will be improved and more rare disease–causing alleles will be identified.
Epigenetics
All cells within your body have the same copy of DNA. For example, a brain neuron has the same DNA blueprint as does a skin cell on your arm. Although these cells have the same genetic information, they are considered specialized. The reason all cells within the body have the same DNA but different morphologies and functions is that different subsets of genes are turned “on” and “off” within the different cell types. A more precise explanation is that there is differential expression of genes among different cell types. In the case of neuronal cells, a unique subset of genes are active that allow them to grow axons to send and receive messages. This subset of genes will be inactive in non-neuronal cell types such as skin cells. Epigenetics is a branch of genetics that studies how these genes are regulated through mechanisms that do not change the underlying DNA sequence. “Special Topics: Epigenetics and X Chromosome Inactivation” details a well-known example of epigenetics regulation.
The prefix epi- means “on, above, or near,” and epigenetic mechanisms such as DNA methylation and histone modifications occur on, above, or near DNA. The addition of a methyl group (— CH₃) to DNA is known as DNA methylation (Figure 3.34). DNA methylation and other modifications made to the histones around which DNA are wrapped are thought to make chromatin more compact. This DNA is inaccessible to transcription factors and RNA polymerases, thus preventing genes from being turned on (i.e., transcribed). Other histone modifications have the opposite effect by loosening chromatin, which makes genes accessible to transcription factors.

It is important to note that environmental factors can alter DNA methylation and histone modifications and also that these changes can be passed from generation to generation. For example, someone’s epigenetic profile can be altered during a stressful time (e.g., natural disasters, famine, etc.), and those regulatory changes can be inherited by the next generation. Moreover, our epigenetic expression profile changes as we age. For example, certain places in our genome become “hyper” or “hypo” methylated over time. Identical twins also have epigenetic profiles that become more different as they age. Researchers are only beginning to understand what all of these genome-wide epigenetic changes mean. Scientists have also discovered that changes in epigenetic modifications can alter gene expression in ways that contribute to diseases. It is also important to note that, unlike DNA mutations (which permanently change the nucleotide sequence), epigenetic changes can be easily reversed. A lot of research now focuses on how drugs can alter or modulate changes in DNA methylation and histone modifications to treat diseases such as cancer.
Special Topic: Epigenetics and X Chromosome Inactivation

Mary Lyon was a British geneticist who presented a hypothesis for X chromosome inactivation (called the Lyon hypothesis) based on her work and other studies of the day. Females inherit two X chromosomes, one from each parent. Males have one functional X chromosome; however, this does not mean females have more active genes than males. During the genetic embryonic development of many female mammals, one of the X chromosomes is inactivated at random, so females have one functional X chromosome. The process of X chromosome inactivation in females occurs through epigenetic mechanisms, such as DNA methylation and histone modifications. Recent studies have analyzed the role of a long noncoding RNA called X-inactive specific transcript (XIST), which is largely responsible for the random silencing of one of the X chromosomes. The presence of two X chromosomes is the signal for XIST RNA to be expressed so that one X chromosome can be inactivated. However, some cells may have an active paternal X chromosome while other cells may have an active maternal X chromosome. This phenomenon is easily seen in calico and tortoiseshell cats (Figure 3.35). In cats, the gene that controls coat color is found on the X chromosome. During early embryo development, random inactivation of X chromosomes gives rise to populations of cells that express black or orange, which results in the unique coat patterning. Therefore, calico cats are typically always female.
Genetic Testing
To assist with public health efforts, newborn screening for genetic diseases has been available in the United States for over 50 years. One of the first available genetic tests was to confirm a phenylketonuria (PKU) diagnosis in infants, which is easily treatable with a dietary change. Currently, each state decides what genes are included on newborn screening panels and some states even have programs to help with infant medical follow-ups.
There are now hundreds of laboratories that provide testing for a few thousand different genes that can inform medical decisions for infants and adults. What has made this industry possible are the advancements in technology and decreased cost to patients. Moreover, genetic testing has been made available publicly to anyone without the assistance of medical professionals.
Clinical Testing
Clinical genetics tests assist patients with making medically informed decisions about family planning and health. Applications of this technology include assistance with in vitro fertilization (IVF) procedures, embryo genetic screening, and personalized medicine such as matching patients to cancer therapies. To ensure accuracy of patient genetic screening, it is important that all clinical laboratories are regulated. The Clinical Laboratory Improvement Amendments (CLIA) are United States federal standards that all human laboratory testing clinics must follow. A major benefit provided by some clinical genetic testing companies is access to genetic counselors, who have specialized education and training in medical genetics and counseling. For individuals with a family history of genetic disease, a physician may recommend genetic carrier screening to see if there is a risk for passing on a disease to a child. Genetic counselors provide expertise with interpretation of genetic testing results, as well as help guide and support patients when making impactful medical decisions.
Direct-to-Consumer (DTC) Genetic Testing
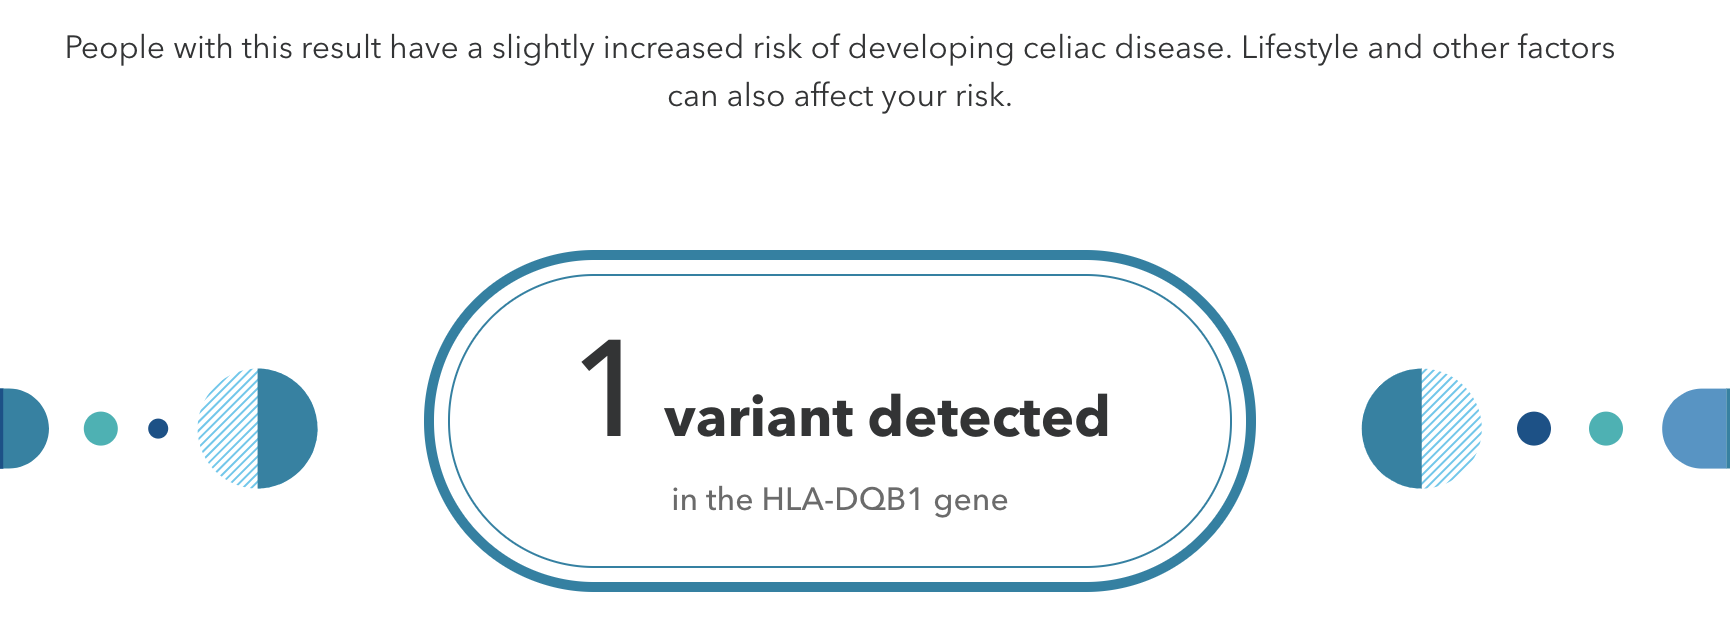
Genetic testing that is performed without the guidance of medical professionals is called direct-to-consumer (DTC) genetic testing. Companies that sell affordable genome sequencing products to the public continue to increase in popularity. These companies have marketing campaigns typically based on the notion of personal empowerment, which can be achieved by knowing more about your DNA. For example, if you are identified as having a slightly increased risk for developing celiac disease (Figure 3.36), then you may be motivated to modify your dietary consumption by removing gluten from your diet. Another scenario is that you could test positive for a known pathogenic BRCA1 or BRCA2 cancer-predisposing allele. In this case, you may want to follow up with a physician and obtain additional clinical testing, which could lead to life-altering decisions. DNA sequencing products for entertainment and lifestyle purposes are also available. For example, some DTC companies offer customized genetic reports for health and fitness, wherein recommendations for optimal exercise workout and meal plans are provided.
DTC testing typically lacks genetic counselor services to consumers, and regulations for nonclinical laboratories are not as strict. This has led to some controversies regarding company genetic products that provide health information. The company 23andMe was the first on the market to offer DTC health testing, and in 2013, the U.S. Food and Drug Administration (FDA) intervened. 23andMe worked toward complying with FDA regulations and then gained approval to offer testing on a few medically related genes. In 2017, 23andMe offered a “Late-Onset Alzheimer’s Disease” genetic risk report. Such offerings have been criticized because customers could receive results they may not fully be able to interpret without professional assistance and advice. In turn, this could increase the stress of participants (sometimes called the “burden of knowing”) and could lead to unnecessary medical intervention.To address this issue, 23andMe now provides disclaimers and also interactive learning modules that customers must complete if they wish to view certain genotyping results. However, individuals who tested positive for a disease-causing allele have also been able to successfully seek medical help. The potential for harm and the proposed benefits of DTC testing continue to be a topic of debate and investigation.
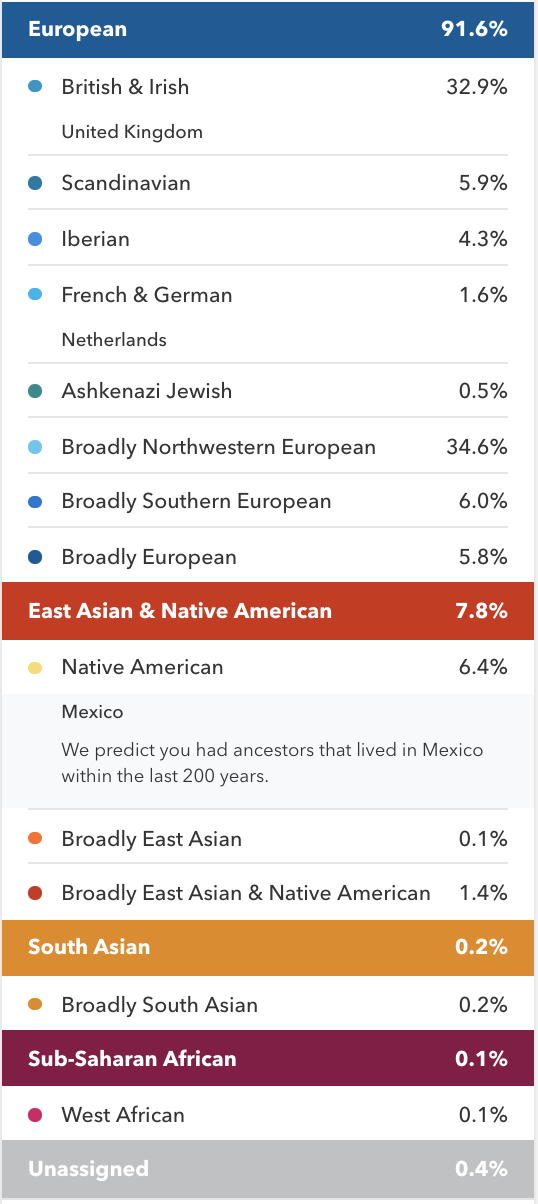
Ancestry percentage tests are also widely popular (Figure 3.37). Customers are genotyped and their alleles are assigned to different groups from around the world (Chapter 4 will discuss human biological variation in further detail). However, the scientific significance and potential harm of ancestry percentage tests have been called into question. For example, most alleles tested are not exclusive to one population, and populations may be defined differently depending on the testing companies. If an allele is assigned to the “Irish” population, there is a good chance that the allele may have evolved in a different cultural group or region that pre-dates the formation of the country Ireland. In other words, genetic variation often pre-dates the origins of the population and geographical names of the region used by genetic testing companies. Another critique is that someone’s identity need not include biological relationships. In using the tests, customers have the option to find and connect online with other individuals with whom they share portions of their genome, which has resulted in both positive and negative personal experiences. Another interesting development in this field is that law enforcement is currently developing forensic techniques that involve mining DTC genomic databases for the purpose of identifying suspects linked to crimes. Regardless of these various considerations, there are now millions of individuals worldwide who have “unlocked the secrets” of their DNA, and the multibillion-dollar genomics market only continues to grow.
As you have seen in this chapter, DNA provides instructions to our cells, which results in the creation and regulation of proteins. Understanding these fundamental mechanisms is important to being able to understand how the evolutionary process works (see Chapter 4) and how humans vary from one another (see Chapters 13 and 14). In addition, advancement in genetic technologies—including ancient DNA studies, genomics, and epigenetics—has led to new anthropological understandings about our biological relationships to other living (extant) and extinct primates. Many of these genetic discoveries will be covered in the chapters to come.
Special Topic: Genetic Biotechnology
Polymerase Chain Reaction (PCR) and Sanger Sequencing
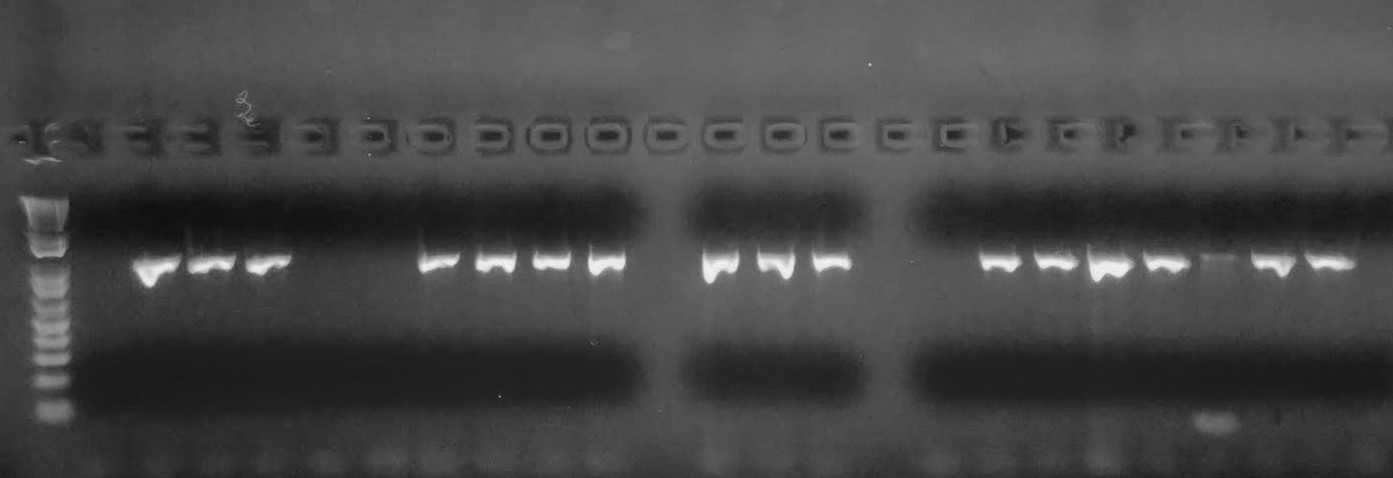
One of the most important inventions in the genetics field was polymerase chain reaction (PCR). In order for researchers to visualize and therefore analyze DNA, the concentration must meet certain thresholds. In 1985, Kary Mullis developed PCR, which can amplify millions of copies of DNA from a very small amount of template DNA (Figure 3.38). For example, a trace amount of DNA at a crime scene can be amplified and tested for a DNA match. Also, aDNA is typically degraded, so a few remaining molecules of DNA can be amplified to reconstruct ancient genomes. The PCR assay uses similar biochemical reactions to our own cells during DNA replication.
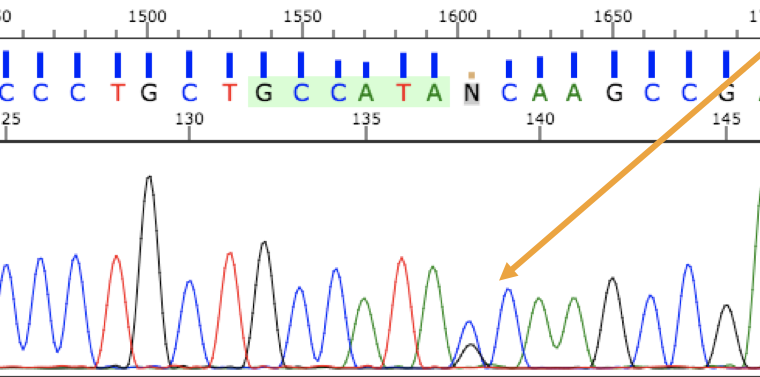
In Sanger sequencing, PCR sequences can be analyzed at the nucleotide level with the help of fluorescent labeling. Several different types of alleles and genetic changes can be detected in DNA by using this analysis. Figure 3.39 shows someone who is heterozygous for a single nucleotide allele. These methods continue to be used extensively alongside larger-scale genome technologies.
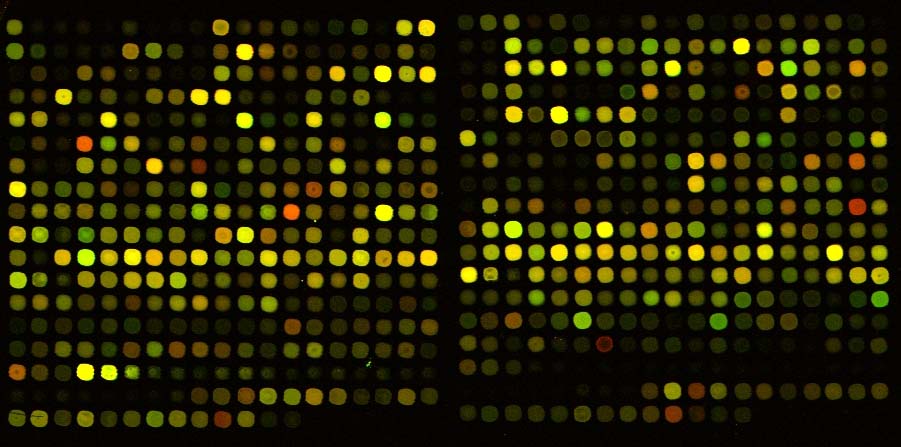
Genetic innovations are transforming the healthcare industry. However, the different types of technology and the results of these tests often include a learning curve for patients, the public, and medical practitioners. Microarray technology, by which DNA samples are genotyped (or “screened”) for specific alleles, has been available for quite some time (Figure 3.40). Presently, microarray chips can include hundreds of alleles that are known to be associated with various diseases. The microarray chip only binds with a DNA sample if it is “positive” for that particular allele and a fluorescent signal is emitted, which can be further analyzed.
Next-generation sequencing (NGS) is a newer technology that can screen the entire genome by analyzing millions of sequences within a single machine run. If a patient is suspected of having a rare genetic condition that cannot be easily diagnosed or the diagnosis is entirely unknown, whole genome sequencing may be recommended by a doctor. However, sequencing the entire genome is still not a cost-effective healthcare approach. Therefore, clinical NGS genetic testing typically only includes a smaller subset of the genome known to have pathogenic disease-causing mutations (i.e., the gene-coding, or “exonic,” regions of the genome). Sequencing cancer tumor genomes is another significant application of this technology. To better understand how genetic mutations affect gene expression patterns, tumor genomic analysis also often involves RNA sequencing (known as the “transcriptome”). The primary goal of this complex “multi-omics” analysis is to provide personalized medicine, where patient outcome can be improved by administering tailored targeted therapies.
Review Questions
- What is the purpose of DNA replication? Explain in a few sentences what happens during DNA replication. When do DNA mutations happen? And how does this create phenotypic variation (i.e., different phenotypes of the same physical trait)?
- Using your own words, what are homologous chromosomes and sister chromatids? What are the key differences between mitosis and meiosis?
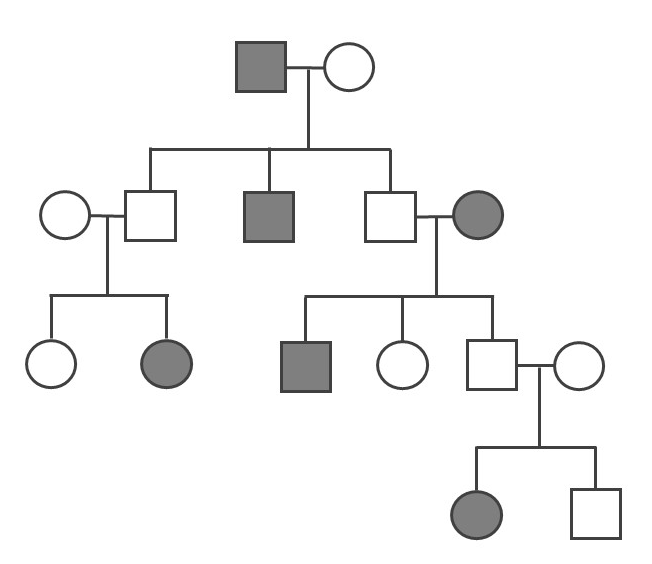
- Determine if the pedigree diagram below (Figure 3.41) represents an autosomal dominant, autosomal recessive, or X-linked recessive pattern of inheritance. You should write the genotype (i.e., AA, Aa, or aa) above each square to help you (note: there may sometimes be two possible answers for a square’s genotype). Please also explain why you concluded a particular pattern of inheritance.
- Use base pairing rules to transcribe the following DNA template sequence into mRNA: GTAAAGGTGCTGGCCATC. Next, use the protein codon table (see Figure 3.21) to translate the sequence. In regard to transcription, explain what the significance is of the first and last codon/protein in the sequence.
- In your opinion, what do you think the benefits are of direct-to-consumer (DTC) genetic testing? What are the drawbacks and/or greater ethical concerns? Do you think benefits outweigh concerns?
- Imagine that you submit your DNA sample to a genetic testing company and among the various diseases for which they test, there is an allele that is associated with late-onset Alzheimer’s disease. You have the option to view your Alzheimer’s result or to not view your result. What do you do and why?
Key Terms
Adenosine triphosphate (ATP): A high-energy compound produced by mitochondria that powers cellular processes.
Allele: A nonidentical DNA sequence found in the same gene location on a homologous chromosome, or gene copy, that codes for the same trait but produces a different phenotype.
Amino acids: Organic molecules that are the building blocks of protein. Each of the 20 different amino acids have their own unique chemical property. Amino acids are chained together to form proteins.
Ancient DNA (aDNA): DNA that is extracted from organic remains and that often dates from hundreds to thousands of years ago. Also, aDNA is typically degraded (i.e., damaged) due to exposure to the elements such as heat, acidity, and humidity.
Aneuploid: A cell with an unexpected amount of chromosomes. The loss or gain of chromosomes can occur during mitotic or meiotic division.
Antibodies: Immune-related proteins that can detect and bind to foreign substances in the blood such as pathogens.
Apoptosis: A series of molecular steps that is activated leading to cell death. Apoptosis can be activated when a cell fails checkpoints during the cell cycle; however, cancer cells have the ability to avoid apoptosis.
Autosomal: Refers to a pattern of inheritance in which an allele is located on an autosome (non sex chromosome).
Base pairs: Chemical bonding between nucleotides. In DNA, adenine (A) pairs with thymine (T) and cytosine (C) pairs with guanine (G); in RNA, adenine (A) always pairs with uracil (U).
Carbohydrate: Molecules composed of carbon and hydrogen atoms that can be broken down to supply energy.
Carrier: An individual who has a heterozygous genotype that is typically associated with a disease.
Cell cycle: A cycle the cell undergoes with checkpoints between phases to ensure that DNA replication and cell division occur properly.
Cell surface antigen: A protein that is found on a red blood cell’s surface.
Centromere: A structural feature that is defined as the “center” of a chromosome and that creates two different arm lengths. This term also refers to the region of attachment for microtubules during mitosis and meiosis.
Chromatin: DNA wrapped around histone complexes. During cell division, chromatin becomes a condensed chromosome.
Chromosome: DNA molecule that is wrapped around protein complexes, including histones.
Codominance: The effects of both alleles in a genotype can be seen in the phenotype.
Codons: A sequence that comprises three DNA nucleotides that together code for a protein.
Complex diseases: A category of diseases that are polygenic and are also influenced by environment and lifestyle factors.
Cytoplasm: The “jelly-like” matrix inside of the cell that contains many organelles and other cellular molecules.
Deleterious: A mutation that increases an organism’s susceptibility to disease.
Deoxyribonucleic acid (DNA): A molecule that carries the hereditary information passed down from parents to offspring. DNA can be described as a “double helix”’ shape. It includes two chains of nucleotides held together by hydrogen bonds with a sugar phosphate backbone.
Diploid: Refers to an organism or cell with two sets of chromosomes.
DNA methylation: Methyl groups bind DNA, which modifies the transcriptional activity of a gene by turning it “on” or “off.”
DNA polymerase: Enzyme that adds nucleotides to existing nucleic acid strands during DNA replication. These enzymes can be distinguished by their processivity (e.g., DNA replication).
DNA replication: Cellular process in which DNA is copied and doubled.
DNA sequence: The order of nucleotide bases. A DNA sequence can be short, long, or representative of entire chromosomes or organismal genomes.
Dominant: Refers to an allele for which one copy is sufficient to be visible in the phenotype.
Elongation: The assembly of new DNA from template strands with the help of DNA polymerases.
Enzymes: Proteins responsible for catalyzing (accelerating) various biochemical reactions in cells.
Epigenetic profile: The methylation pattern throughout a genome—that is, which genes (and other genomic sites) are methylated and unmethylated.
Epigenetics: Changes in gene expression that do not result in a change of the underlying DNA sequence. These changes typically involve DNA methylation and histone modifications. These changes are reversible and can also be inherited by the next generation.
Euchromatin: Loosely coiled chromosomes found within the nucleus that are accessible for regulatory processing of DNA.
Eukaryote: Single-celled or multicelled organism characterized by a distinct nucleus, with each organelle surrounded by its own membrane.
Exon: Protein-coding segment of a gene.
Gametes: Haploid cells referred to as an egg and sperm that will fuse together during sexual reproduction to form a diploid organism.
Gene: Segment of DNA that contains protein-coding information and various regulatory (e.g., promoter) and noncoding (e.g., introns) regions.
Genetic recombination: A cellular process that occurs during meiosis I in which homologous chromosomes pair up and sister chromatids on different chromosomes physically swap genetic information.
Genome: All the genetic information of an organism.
Genotype: The combination of two alleles that code for or are associated with the same gene.
Genotyping: A molecular procedure that is performed to test for the presence of certain alleles or to discover new ones.
Germ cells: Specialized cells that form gametes (egg and sperm cells).
Haploid: Cell or organism with one set of chromosomes (n = 23).
Helicase: A protein that breaks the hydrogen bonds that hold double-stranded DNA together.
Heterozygous: Genotype that consists of two different alleles.
Histones: Proteins that DNA wraps around to assist with DNA organization within the nucleus.
Homologous chromosomes: A matching pair of chromosomes wherein one chromosome is maternally inherited and the other is paternally inherited.
Homozygous: Genotype that consists of two identical alleles.
Incomplete dominance: Heterozygous genotype that produces a phenotype that is a blend of both alleles.
Initiation: The recruitment of proteins to separate DNA strands and begin DNA replication.
Interphase: Preparatory period of the cell cycle when increased metabolic demand allows for DNA replication and doubling of the cell prior to cell division.
Introns: Segment of DNA that does not code for proteins.
Karyotyping: The microscopic procedure wherein the number of chromosomes in a cell is determined.
Lagging strand: DNA template strand that is opposite to the leading strand during DNA replication. This strand is created in several disconnected sections and other enzymes fill in the missing nucleotide gaps between these sections.
Leading strand: DNA template strand in which replication proceeds continuously.
Lipids: Fatty acid molecules that serve various purposes in the cell, including energy storage, cell signaling, and structure.
Meiosis: The process that gametes undergo to divide. The end of meiosis results in four haploid daughter cells.
Mendelian genetics: A classification given to phenotypic traits that are controlled by a single gene.
Messenger RNA (mRNA): RNA molecule that is transcribed from DNA. Its tri-nucleotide codons are “read” by a ribosome to build a protein.
Microarray technology: A genotyping procedure that utilizes a microarray chip, which is a collection of thousands of short nucleotide sequences attached to a solid surface that can probe genomic DNA.
Microbiome: The collective genomes of the community of microorganisms that humans have living inside of their bodies.
Mitochondrial DNA (mtDNA): Circular DNA segment found in mitochondria that is inherited maternally.
Mitochondrion: Specialized cellular organelle that is the site for energy production. It also has its own genome (mtDNA).
Mitosis: The process that somatic cells undergo to divide. The end of mitosis results in two diploid daughter cells.
Molecular anthropologists: Individuals who use molecular techniques (primarily genetics) to compare ancient and modern populations and to study living populations of humans and nonhuman primates.
Molecular geneticists: Biologists that study the structure and function of genes.
Mutation: A nucleotide sequence variation from the template DNA strand that can occur during replication. Mutations can also happen during recombination.
Next-generation sequencing: A genotyping technology that involves producing millions of nucleotide sequences (from a single DNA sample) that are then read with a sequencing machine. It can be used for analyzing entire genomes or specific regions and requires extensive program-based applications.
Nuclear envelope: A double-layered membrane that encircles the nucleus.
Nucleic acid: A complex structure (like DNA or RNA) that carries genetic information about a living organism.
Nucleotide: The basic structural component of nucleic acids, which includes DNA (A, T, C, and G) and RNA (A, U, C, and G).
Nucleus: Double-membrane cellular organelle that helps protect DNA and also regulates nuclear activities.
Organelle: A structure within a cell that performs specialized tasks that are essential for the cell. There are different types of organelles, each with its own function.
Pathogenic: A genetic mutation (i.e., allele) that has a harmful phenotypic disease-causing effect.
Pedigree: A diagram of family relationships that indicates which members may have or carry certain genetic and/or phenotypic traits.
Penetrance: The proportion of how often the possession of an allele results in an expected phenotype. Some alleles are more penetrant than others.
Phenotype: The physical appearance of a given trait.
Phospholipid bilayer: Two layers of lipids that form a barrier due to the properties of a hydrophilic (water-loving) head and a hydrophobic (water-repelling) tail.
Polygenic trait: A phenotype that is controlled by two or more genes.
Polymerase chain reaction (PCR): A molecular biology procedure that can make copies of genomic DNA segments. A small amount of DNA is used as a starting template and is then used to make millions of copies.
Prokaryote: A single-celled organism characterized by the lack of a nucleus and membrane-enclosed organelles.
Promoter: The region of a gene that initiates transcription. Transcription factors can bind and DNA methylation may occur at a promoter site, which can modify the transcriptional activities of a gene.
Protein: Chain of amino acids that folds into a three-dimensional structure that allows a cell to function in a variety of ways.
Protein synthesis: A multi-step process by which amino acids are strung together by RNA machinery read from a DNA template.
Recessive: Refers to an allele whose effect is not normally seen unless two copies are present in an individual’s genotype.
Ribonucleic acid (RNA): Single-stranded nucleic acid molecule.There are different RNAs found within cells and they perform a variety of functions, such as cell signaling and involvement in protein synthesis.
Ribosomal RNA (rRNA): A ribosome-bound molecule that is used to correctly assemble amino acids into proteins.
Ribosome: An organelle in the cell found in the cytoplasm or endoplasmic reticulum. It is responsible for reading mRNA and protein assemblage.
RNA polymerase: An enzyme that catalyzes the process of making RNA from a DNA template.
Sanger-sequencing: A process that involves the usage of fluorescently labeled nucleotides to visualize DNA (PCR fragments) at the nucleotide level.
Semi-conservative replication: DNA replication in which new DNA is replicated from an existing DNA template strand.
Sequencing: A molecular laboratory procedure that produces the order of nucleotide bases (i.e., sequences).
Sister chromatids: During DNA replication, sister chromatids are produced on the chromosome. In cell division, sister chromatids are pulled apart so that two cells can be formed. In meiosis, sister chromatids are also the sites of genetic recombination.
Somatic cells: Diploid cells that comprise body tissues and undergo mitosis for maintenance and repair of tissues.
Splicing: The process by which mature mRNAs are produced. Introns are removed (spliced) and exons are joined together.
Sugar phosphate backbone: A biochemical structural component of DNA. The “backbone” consists of deoxyribose sugars and phosphate molecules.
Telomere: A compound structure located at the ends of chromosomes to help protect the chromosomes from degradation after every round of cell division.
Termination: The halt of DNA replication activity that occurs when a DNA sequence “stop” codon is encountered.
Tissue: A cluster of cells that are morphologically similar and perform the same task.
Transcription: The process by which DNA nucleotides (within a gene) are copied, which results in a messenger RNA molecule.
Transcription factors: Proteins that bind to regulatory regions of genes (e.g., promoter) and increase or decrease the amount of transcriptional activity of a gene, including turning them “on” or “off.”
Transfer RNA (tRNA): RNA molecule involved in translation. Transfer RNA transports amino acids from the cell’s cytoplasm to a ribosome.
Translation: The process by which messenger RNA codons are read and amino acids are “chained together” to form proteins.
X-linked: Refers to a pattern of inheritance where the allele is located on the X or Y chromosome.
About the Author

Hayley Mann, M.A.
Binghamton University, hmann3@binghamton.edu
Hayley Mann received her bachelor’s degree in Genetics from the University of California, Davis, and continued her graduate studies in Biological and Molecular Anthropology at the California State University, Sacramento. She is currently a Ph.D. candidate at Binghamton University, where her dissertation focus is on studying genetic variation of Pacific Islanders (Republic of Vanuatu) and also changes in health as the result of colonization. Hayley also works in clinical molecular carrier screening and specializes in DNA-sequencing procedures.
For Further Exploration
National Human Genome Research Institute
NOVA. 2018. Gene Sequencing Speeds Diagnosis of Deadly Newborn Diseases. NOVA, March 7, 2018. Accessed January 31, 2023. http://www.pbs.org/wgbh/nova/next/body/newborn-gene-sequencing/.
Zimmer, Carl. N.d. “Carl Zimmer’s Game of Genomes.” STATnews. Accessed January 31, 2023. https://www.statnews.com/feature/game-of-genomes/season-one/.
Illumina. 2016. “Illumina Sequencing by Synthesis.” YouTube.com, October 5, 2016. Accessed January 31, 2023. https://www.youtube.com/watch?v=fCd6B5HRaZ8.
References
Aartsma-Rus, Annemieke, Ieke B. Ginjaar, and Kate Bushby. 2016. “The Importance of Genetic Diagnosis for Duchenne Muscular Dystrophy.” Journal of Medical Genetics 53 (3): 145–151.
Acuna-Hidalgo, Rocio, Joris A. Veltman, and Alexander Hoischen. 2016. “New Insights into the Generation and Role of De Novo Mutations in Health and Disease.” Genome Biology 17 (241): 1–19.
Albert, Benjamin, Susanna Tomassetti, Yvonne Gloor, Daniel Dilg, Stefano Mattarocci, Slawomir Kubik, Lukas Hafner, and David Shore. 2019. “Sfp1 Regulates Transcriptional Networks Driving Cell Growth and Division through Multiple Promoter-Binding Modes.” Genes & Development 33 (5–6): 288–293.
Almathen, Faisal, Haitham Elbir, Hussain Bahbahani, Joram Mwacharo, and Olivier Hanotte. 2018. “Polymorphisms in Mc1r and Asip Genes Are Associated with Coat Color Variation in the Arabian Camel.” Journal of Heredity 109 (6): 700–706.
Ballester, Leomar Y., Rajyalakshmi Luthra, Rashmi Kanagal-Shamanna, and Rajesh R. Singh. 2016. “Advances in Clinical Next-Generation Sequencing: Target Enrichment and Sequencing Technologies.” Expert Review of Molecular Diagnostics 16 (3): 357–372.
Baranovskiy, Andrey G., Vincent N. Duong, Nigar D. Babayeva, Yinbo Zhang, Youri I. Pavlov, Karen S. Anderson, and Tahir H. Tahirov. 2018. “Activity and Fidelity of Human DNA Polymerase Alpha Depend on Primer Structure.” Journal of Biological Chemistry 293 (18): 6824–6843.
Brezina, Paulina R., Raymond Anchan, and William G. Kearns. 2016. “Preimplantation Genetic Testing for Aneuploidy: What Technology Should You Use and What Are the Differences?” Journal of Assisted Reproduction and Genetics 33 (7): 823–832.
Bultman, Scott J. 2017. “Interplay Between Diet, Gut Microbiota, Epigenetic Events, and Colorectal Cancer.” Molecular Nutrition & Food Research 61 (1):1–12.
Cutting, Garry R. 2015. “Cystic Fibrosis Genetics: From Molecular Understanding to Clinical Application.” Nature Reviews Genetics 16 (1): 45–56.
D’Alessandro, Giuseppina., and Fabrizio d’Adda di Fagagna. 2017. “Transcription and DNA Damage: Holding Hands or Crossing Swords?” Journal of Molecular Biology 429 (21): 3215–3229.
De Craene, Johan-Owen, Dimitri L. Bertazzi, Séverine Bar, and Sylvie Friant. 2017. “Phosphoinositides, Major Actors in Membrane Trafficking and Lipid Signaling Pathways.” International Journal of Molecular Sciences 18 (3): 1–20.
Deng, Lian, and Shuhua Xu. 2018. “Adaptation of Human Skin Color in Various Populations.” Hereditas 155 (1): 1–12.
Dever, Thomas E., Terri G. Kinzy, and Graham D. Pavitt. 2016. “Mechanism and Regulation of Protein Synthesis in Saccharomyces Cerevisiae.” Genetics 203 (1): 65–107.
Eme, Laura, Anja Spang, Jonathan Lombard, Courtney W. Stairs, and Thijs J. G. Ettema. 2017. “Archaea and the Origin of Eukaryotes.” Nature Reviews Microbiology 15 (12): 711–723.
Gomez-Carballa, Alberto, Jacobo Pardo-Seco, Stefania Brandini, Alessandro Achilli, Ugo A. Perego, Michael D. Coble, Toni M. Diegoli, et al. 2018. “The Peopling of South America and the Trans-Andean Gene Flow of the First Settlers.” Genome Research 28 (6): 767–779.
Gvozdenov, Zlata, Janhavi Kolhe, and Brian C. Freeman. 2019. “The Nuclear and DNA-Associated Molecular Chaperone Network.” Cold Spring Harbor Perspectives in Biology 11 (10): a034009.
Harkins, Kelly M., and Anne C. Stone. 2015. “Ancient Pathogen Genomics: Insights into Timing and Adaptation.” Journal of Human Evolution 79: 137–149.
Jackson, Maria, Leah Marks, Gerhard H. W. May, and Joanna B. Wilson. 2018. “The Genetic Basis of Disease.” Essays in Biochemistry 62 (5): 643–723.
Lenormand, Thomas, Jan Engelstadter, Susan E. Johnston, Erik Wijnker, and Christopher R. Haag. 2016. “Evolutionary Mysteries in Meiosis.” Philosophical Transactions of the Royal Society B 371: 1–14.
Levy, Shawn E., and Richard M. Myers. 2016. “Advancements in Next-Generation Sequencing.” Annual Review of Genomics and Human Genetics 17: 95–115.
Lindo, John, Emilia Huerta-Sánchez, Shigeki Nakagome, Morten Rasmussen, Barbara Petzelt, Joycelynn Mitchell, Jerome S. Cybulski, et al. 2016. “A Time Transect of Exomes from a Native American Population Before and After European Contact.” Nature Communications 7: 1–11. https://doi.org/10.1038/ncomms13175.
Lu, Mengfei, Cathryn M. Lewis, and Matthew Traylor. 2017. “Pharmacogenetic Testing through the Direct-to-Consumer Genetic Testing Company 23andme.” BMC Medical Genomics 10 (47): 1–8.
Ly, Lundi, Donovan Chan, Mahmoud Aarabi, Mylene Landry, Nathalie A. Behan, Amanda J. MacFarlane, and Jacquetta Trasler. 2017. “Intergenerational Impact of Paternal Lifetime Exposures to Both Folic Acid Deficiency and Supplementation on Reproductive Outcomes and Imprinted Gene Methylation.” Molecular Human Reproduction 23 (7): 461–477.
Ma, Wenxiu, Giancarlo Bonora, Joel B. Berletch, Xinxian Deng, William S. Noble, and Christine M. Disteche. 2018. “X-Chromosome Inactivation and Escape from X Inactivation in Mouse.” Methods in Molecular Biology 1861: 205–219.
Machiela, Mitchell J., Weiyin Zhou, Eric Karlins, Joshua N. Sampson, Neal D. Freedman, Qi Yang, Belynda Hicks, et al. 2016. “Female Chromosome X Mosaicism Is Age-Related and Preferentially Affects the Inactivated X Chromosome.” Nature Communications 7: 1–9. https://doi.org/10.1038/ncomms11843.
Mahdavi, Morteza, Mohammadreza Nassiri, Mohammad M. Kooshyar, Masoume Vakili-Azghandi, Amir Avan, Ryan Sandry, Suja Pillai, Alfred K. Lam, and Vinod Gopalan. 2019. “Hereditary Breast Cancer; Genetic Penetrance and Current Status with BRCA.” Journal of Cellular Physiology 234 (5): 5741–5750.
McDade, Thomas W., Calen P. Ryan, Meaghan J. Jones, Morgan K. Hoke, Judith Borja, Gregory E. Miller, Christopher W. Kuzawa, and Michael S. Kobor. 2019. “Genome-Wide Analysis of DNA Methylation in Relation to Socioeconomic Status During Development and Early Adulthood.” American Journal of Physical Anthropology 169 (1): 3–11.
Migeon, Barbara R. 2017. “Choosing the Active X: The Human Version of X Inactivation.” Trends in Genetics 33 (12): 899–909.
Myerowitz, Rachel. 1997. “Tay-Sachs Disease-Causing Mutations and Neutral Polymorphisms in the Hex A Gene.” Human Mutation 9 (3): 195–208.
Onufriev, Alexey V., and Helmut Schiessel. 2019. “The Nucleosome: From Structure to Function through Physics.” Current Opinion in Structural Biology 56: 119–130.
Quillen, Ellen E., Heather L. Norton, Esteban J. Parra, Frida Lona-Durazo, Khai C. Ang, Florin M. Illiescu, Laurel N. Pearson, et al. 2019. “Shades of Complexity: New Perspectives on the Evolution and Genetic Architecture of Human Skin.” American Journal of Physical Anthropology 168 (67): 4–26.
Raspelli, Erica, and Roberta Fraschini. 2019. “Spindle Pole Power in Health and Disease.” Current Genetics 65 (4): 851–855.
Ravinet, M., R. Faria, R. K. Butlin, J. Galindo, N. Bierne, M. Rafajlovic, M. A. F. Noor, B. Mehlig, and A. M. Westram. 2017. “Interpreting the Genomic Landscape of Speciation: A Road Map for Finding Barriers to Gene Flow.” Journal of Evolutionary Biology 30 (8): 1450–1477.
Regev, Aviv, Sarah A. Teichmann, Eric S. Lander, Ido Amit, Christophe Benoist, Ewan Birney, Bernd Bodenmiller, et al. 2017. “The Human Cell Atlas.” Elife 6e27041: 1–30. https://doi.org/10.7554.eLife.27041.
Roberts, Andrea L., Nicole Gladish, Evan Gatev, Meaghan J. Jones, Ying Chen, Julia L. MacIsaac, Shelley S. Tworoger, et al. 2018. “Exposure to Childhood Abuse Is Associated with Human Sperm DNA Methylation.” Translational Psychiatry 8 (194): 1–11.
Roger, Andrew J., Sergio A. Muñoz-Gómez, and Ryoma Kamikawa. 2017. “The Origin and Diversification of Mitochondria.” Current Biology 27 (21): R1177–R1192. https://www.sciencedirect.com/science/article/pii/S096098221731179X?via%3Dihub#!
Ségurel, Laure, and Céline Bon. 2017. “On the Evolution of Lactase Persistence in Humans.” Annual Review of Genomics and Human Genetics 18: 297–319.
Sheth, Bhavisha P., and Vrinda S. Thaker. 2017. “DNA Barcoding and Traditional Taxonomy: An Integrated Approach for Biodiversity Conservation.” Genome 60 (7): 618–628.
Skloot, Rebecca. 2010. The Immortal Life of Henrietta Lacks. New York: Crown Publishing Group.
Snedeker, Jonathan, Matthew Wooten, and Xin Chen. 2017. “The Inherent Asymmetry of DNA Replication.” Annual Review of Cell and Developmental Biology 33: 291–318.
Sullivan-Pyke, Chantae, and Anuja Dokras. 2018. “Preimplantation Genetic Screening and Preimplantation Genetic Diagnosis.” Obstetrics and Gynecology Clinics of North America 45 (1): 113–125.
Szostak, Jack W. 2017. “The Narrow Road to the Deep Past: In Search of the Chemistry of the Origin of Life.” Angewandte Chemie International Edition 56 (37): 11037–11043.
Tessema, Mathewos, Ulrich Lehmann, and Hans Kreipe. 2004. “Cell Cycle and No End.” Virchows Archiv European Journal of Pathology 444 (4): 313–323.
Tishkoff, Sarah A., Floyd A. Reed, Alessia Ranciaro, Benjamin F. Voight, Courtney C. Babbitt, Jesse S. Silverman, Kweli Powell, et al. 2007. “Convergent Adaptation of Human Lactase Persistence in Africa and Europe.” Nature Genetics 39 (1): 31–40.
Visootsak, Jeannie, and John M. Graham, Jr. 2006. “Klinefelter Syndrome and Other Sex Chromosomal Aneuploidies.” Orphanet Journal of Rare Diseases 1:42. https://doi.org/10.1186/1750-1172-1-42.
Wolfe, George C., dir. 2017. The Immortal Life of Henrietta Lacks. HBO Films, April 22, 2017. TV Movie.
Yamamoto, Fumi-ichiro, Henrik Clausen, Thayer White, John Marken, and Sen-itiroh Hakomori. 1990. “Molecular Genetic Basis of the Histo-Blood Group ABO System.” Nature 345 (6272): 229–233.
Zlotogora, Joël. 2003. “Penetrance and Expressivity in the Molecular Age.” Genetics in Medicine 5 (5): 347–352.
Zorina-Lichtenwalter, Katerina, Ryan N. Lichtenwalter, Dima V. Zaykin, Marc Parisien, Simon Gravel, Andrey Bortsov, and Luda Diatchenko. 2019. “A Study in Scarlet: MC1R as the Main Predictor of Red Hair and Exemplar of the Flip-Flop Effect.” Human Molecular Genetics 28 (12): 2093-2106.
Zwart, Haeh. 2018. “In the Beginning Was the Genome: Genomics and the Bi-Textuality of Human Existence.” New Bioethics 24 (1): 26–43.
Image Description
Figure 3.2: Two cells drawn with openings so the inside organelles can be viewed and labeled. The eukaryotic cell is square shaped with a thick cell membrane around the outside. DNA is inside a circular membrane-enclosed nucleus. Labeled arrows point to different shaped membrane-enclosed organelles and ribosomes (represented by small dots). The prokaryotic cell has a capsule shape and a flagellum (tail). The thick cell wall is labeled, as is the cell membrane underneath it. DNA is loosely coiled in the nucleoid, ribosomes are represented by small dots.
Figure 3.3: Two cells are depicted with different shaped organelles inside them. The plant cell is square with a thick cellulose cell wall outside the cell membrane. The cytoplasm inside holds many chloroplasts (green ovals), two mitochondrion (brown ovals with wavy lines inside), and a circular nucleus containing loose DNA strands. A large permanent vacuole (empty space) is shown. The animal cell is round, with a thin cell wall. The cytoplasm holds different shaped organelles including a few mitochondria and a circular nucleus containing loose DNA strands.
Figure 3.4: The phospholipid bilayer is constructed of two sheet-like layers of lipid molecules. The individual lipid molecules have hydrophobic tails and hydrophilic heads. The tail-side of the two sheets form the middle of the bilayer, with the heads forming the outsides of the bilayer.
Under the bilayer are filaments of the cytoskeleton (drawn as thick wavy lines). Imbedded in the phospholipid bilayer are:
- Glycoproteins: proteins with carbohydrate attached,
- Glycolipid: lipid with carbohydrate attached,
- Peripheral membrane proteins (fit in only one layer),
- Integral membrane proteins (that extend all the way through the bilayer),
- Cholesterol (small molecules in only one layer), and
- Protein channels (hat extend all the way through the bilayer)
Figure 3.5: A three-dimensional cell is partly opened to expose various labeled organelles. These include:
- A sphere shaped nucleus containing a smaller sphere shaped nucleolus,
- Ribosomes depicted as small dots,
- Rough endoplasmic reticulum shown as long thin membranes outside of the nucleus,
- Smooth endoplasmic reticulum near the rough ER,
- Mitochondria shown as small oval organelles with a wavy membrane inside. Some have microtubules (lines) extending from them.
- Tube like centrioles,
- Golgi body appearing as a stacked membrane, and
- Lysosomes appear as small dots outside the nucleus.
Figure 3.9: The DNA double helix is shown wound around nucleosomes. Each nucleosome is made of clustered spherical histones and the DNA wraps around it twice. The DNA wound around nucleosomes resembles “beads on a string.” Many wrapped and condensed nucleosomes form chromatin fiber, which are further wound into an X-shaped chromosome.
Figure 3.12: Original (template) DNA extends from an X shaped chromosome, and its two strands are separated at the replication fork by helicase (an enzyme depicted as a triangle). The bottom original template strand has DNA polymerase moving away from the replication fork to create a new lagging strand DNA by adding free nucleotides. On the upper strand of original DNA, DNA polymerase works toward the replication fork, adding free nucleotides to build the leading strand.
Figure 3.15: This pie chart shows the proportion of time spent in each cell phase. The shortest phases are the mitotic phases (mitosis followed by cytokinesis) which lead to the formation of two daughter cells. This is followed by a long cell growth (G1, interphase), DNA synthesis (S, interphase), and cell growth (G2, interphase), before returning to the mitotic phase.
Figure 3.17: Image depicts protein synthesis as divided into three phases, and shows the molecules involved at each phase, and that are used to help create the following document. First, in transcription, DNA (double stranded) is used as a template to create pre-mRNA (single stranded). Second, in RNA processing (also called splicing), pre-mRNA is modified to form a shorter mature mRNA. Lastly, in translation, mature mRNA is used as instructions to link together spherical amino acids in a chain, or protein.
Figure 3.18: The single-stranded structure of RNA is shown with a backbone of sugar-phosphates in a helical shape and nucleobases are shown as rungs on a ladder. On the left side of the figure, the chemical structure of each nucleobase is depicted: cytosine (C), guanine (G), adenine (A), and uracil (U).
Figure 3.19: A stretch of double stranded DNA is depicted in the process of transcription. The two strands are pulled apart in the middle, the top strand forms the template strand. RNA polymerase (a bubble shaped enzyme) sits on the template strand and adds free nucleotides to a growing RNA transcript. The DNA template strand reads ATGACGGATCAG… and the RNA strand is complementary and contains uracil (U; UACUGCCUAGUC…).
Figure 3.20: At the top of the diagram, sections of a gene (DNA) are labeled: a promoter region followed by alternating sections of exons (filled in with horizontal lines) and introns (vertical lines). In the middle of the diagram, the pre mRNA transcription contains copies of the alternating exon and intron portions with lines drawn in. The bottom strand (mature mRNA) shows the introns removed and the exons (all horizontal lines) connected.
Figure 3.21: A roughly circular ribosome sits on a mRNA strand and facilitates the transfer of amino acids (dots) carried by tRNA to a growing amino acid (peptide) chain. Amino acids appear as different colored dots on a string. Their abbreviations and full names are listed.
- alanine— ala
- arginine— arg
- asparagine— asn
- aspartic acid— asp
- cysteine— cys
- glutamine— gln
- glutamic acid— glu
- glycine— gly
- histidine— his
- isoleucine— ile
- leucine— leu
- lysine— lys
- methionine— met
- phenylalanine— phe
- proline— pro
- serine— ser
- threonine— thr
- tryptophan– trp
- tyrosine— tyr
- valine— val
Figure 3.22: Accessible full text RNA codon to amino acid table
Figure 3.26: Grid illustration of the pollen of a purple-flowered pea plant (heterozygous genotype of capital B and lowercase b) mixing with the pistol (also a heterozygous genotype of capital B and lowercase b) could create combinations of genotypes: two capital B alleles (purple flower), capital B and lowercase B alleles (purple flower), or two lower case b alleles (white flower).
Figure 3.28: A grid format uses images of circles for the red blood cells, covered with smaller shapes, to depict antigens on blood types. Shapes that fit against the antigen shapes like puzzle pieces depict antibodies that can bind antigens.
For ABO blood types:
- A has circular (A) antigens on the cell, and V-shaped antibodies capable of binding B antigens.
- B has triangular (B) antigens on the cell, and moon-shaped antibodies capable of binding A antigens.
- AB has circular (A) and triangle (B) antigens. No corresponding antibodies.
- O has no antigens, and both V-shaped and moon-shaped antibodies capable of binding A and B antigens.
For Rh Blood types:
- Rh+ has rectangular (Rh) antigens on the cell. No corresponding antibodies.
- Rh- has no specific antigens, and box-shaped antibodies capable of binding Rh antigens.
Figure 3.29: A 3×3 Punnett-square grid showing the genotypes that result when the different ABO blood type alleles come together. A, B, and O constitute both the row and column headers. The cells are the resulting genotype (two combined alleles).
Top row: AA, AB, AO
Middle row: AB, BB, BO
Bottom row: AO, BO, OO
Figure 3.34: Two images each show DNA wrapped around a series of histones. The top image shows DNA wrapped around seven tightly clustered histones. Many methyl groups (small dots) are on the DNA and on histone tails. A portion of the DNA tucked between two histones is highlighted as a gene and labeled “DNA inaccessible, gene inactive”. Text reads: Methylation of DNA and histones causes nucleosomes to pack tightly together. Transcription factors cannot bind the DNA, and genes are not expressed. The bottom image shows DNA wrapping around three widely spaced histones, with a highlighted active gene (where the DNA is accessible between two histones). Acetyl groups are attached to histone tails. Text reads: Histone acetylation results in loose packing of nucleosomes. Transcription factors can bind the DNA and genes are expressed.
Chain of amino acids that folds into a three-dimensional structure that allows a cell to function in a variety of ways.
Fatty acid molecules that serve various purposes in the cell, including energy storage, cell signaling, and structure.
Molecules composed of carbon and hydrogen atoms that can be broken down to supply energy.
A complex structure (like DNA or RNA) that carries genetic information about a living organism.
A molecule that carries the hereditary information passed down from parents to offspring. DNA can be described as a “double helix”’ shape. It includes two chains of nucleotides held together by hydrogen bonds with a sugar phosphate backbone.
A single-celled organism characterized by the lack of a nucleus and membrane-enclosed organelles.
Single-celled or multicelled organism characterized by a distinct nucleus, with each organelle surrounded by its own membrane.
A structure within a cell that performs specialized tasks that are essential for the cell. There are different types of organelles, each with its own function.
The collective genomes of the community of microorganisms that humans have living inside of their bodies.
A cluster of cells that are morphologically similar and perform the same task.
Two layers of lipids that form a barrier due to the properties of a hydrophilic (water-loving) head and a hydrophobic (water-repelling) tail.
The “jelly-like” matrix inside of the cell that contains many organelles and other cellular molecules.
Double-membrane cellular organelle that helps protect DNA and also regulates nuclear activities.
Specialized cellular organelle that is the site for energy production. It also has its own genome (mtDNA).
A high-energy compound produced by mitochondria that powers cellular processes.
Circular DNA segment found in mitochondria that is inherited maternally.
A ribosome-bound molecule that is used to correctly assemble amino acids into proteins.
A double-layered membrane that encircles the nucleus.
Biologists that study the structure and function of genes.
A nucleotide sequence variation from the template DNA strand that can occur during replication. Mutations can also happen during recombination.
Individuals who use molecular techniques (primarily genetics) to compare ancient and modern populations and to study living populations of humans and nonhuman primates.
DNA that is extracted from organic remains and that often dates from hundreds to thousands of years ago. Also, aDNA is typically degraded (i.e., damaged) due to exposure to the elements such as heat, acidity, and humidity.
The basic structural component of nucleic acids, which includes DNA (A, T, C, and G) and RNA (A, U, C, and G).
A biochemical structural component of DNA. The “backbone” consists of deoxyribose sugars and phosphate molecules.
Chemical bonding between nucleotides. In DNA, adenine (A) pairs with thymine (T) and cytosine (C) pairs with guanine (G); in RNA, adenine (A) always pairs with uracil (U).
Proteins that DNA wraps around to assist with DNA organization within the nucleus.
DNA wrapped around histone complexes. During cell division, chromatin becomes a condensed chromosome.
DNA molecule that is wrapped around protein complexes, including histones.
Loosely coiled chromosomes found within the nucleus that are accessible for regulatory processing of DNA.
A structural feature that is defined as the “center” of a chromosome and that creates two different arm lengths. This term also refers to the region of attachment for microtubules during mitosis and meiosis.
A compound structure located at the ends of chromosomes to help protect the chromosomes from degradation after every round of cell division.
The order of nucleotide bases. A DNA sequence can be short, long, or representative of entire chromosomes or organismal genomes.
Cellular process in which DNA is copied and doubled.
A cycle the cell undergoes with checkpoints between phases to ensure that DNA replication and cell division occur properly.
DNA replication in which new DNA is replicated from an existing DNA template strand.
The recruitment of proteins to separate DNA strands and begin DNA replication.
The assembly of new DNA from template strands with the help of DNA polymerases.
The halt of DNA replication activity that occurs when a DNA sequence “stop” codon is encountered.
A protein that breaks the hydrogen bonds that hold double-stranded DNA together.
DNA template strand in which replication proceeds continuously.
DNA template strand that is opposite to the leading strand during DNA replication. This strand is created in several disconnected sections and other enzymes fill in the missing nucleotide gaps between these sections.
Enzyme that adds nucleotides to existing nucleic acid strands during DNA replication. These enzymes can be distinguished by their processivity (e.g., DNA replication).
A mutation that increases an organism’s susceptibility to disease.
Specialized cells that form gametes (egg and sperm cells).
Diploid cells that comprise body tissues and undergo mitosis for maintenance and repair of tissues.
Refers to an organism or cell with two sets of chromosomes.
A matching pair of chromosomes wherein one chromosome is maternally inherited and the other is paternally inherited.
During DNA replication, sister chromatids are produced on the chromosome. In cell division, sister chromatids are pulled apart so that two cells can be formed. In meiosis, sister chromatids are also the sites of genetic recombination.
The process that somatic cells undergo to divide. The end of mitosis results in two diploid daughter cells.
Haploid cells referred to as an egg and sperm that will fuse together during sexual reproduction to form a diploid organism.
The process that gametes undergo to divide. The end of meiosis results in four haploid daughter cells.
A cellular process that occurs during meiosis I in which homologous chromosomes pair up and sister chromatids on different chromosomes physically swap genetic information.
Cell or organism with one set of chromosomes (n = 23).
A cell with an unexpected amount of chromosomes. The loss or gain of chromosomes can occur during mitotic or meiotic division.
The microscopic procedure wherein the number of chromosomes in a cell is determined.
Preparatory period of the cell cycle when increased metabolic demand allows for DNA replication and doubling of the cell prior to cell division.
A series of molecular steps that is activated leading to cell death. Apoptosis can be activated when a cell fails checkpoints during the cell cycle; however, cancer cells have the ability to avoid apoptosis.
Organic molecules that are the building blocks of protein. Each of the 20 different amino acids have their own unique chemical property. Amino acids are chained together to form proteins.
Proteins responsible for catalyzing (accelerating) various biochemical reactions in cells.
A multi-step process by which amino acids are strung together by RNA machinery read from a DNA template.
The process by which DNA nucleotides (within a gene) are copied, which results in a messenger RNA molecule.
The process by which messenger RNA codons are read and amino acids are “chained together” to form proteins.
Single-stranded nucleic acid molecule.There are different RNAs found within cells and they perform a variety of functions, such as cell signaling and involvement in protein synthesis
RNA molecule that is transcribed from DNA. Its tri-nucleotide codons are “read” by a ribosome to build a protein.
The process by which mature mRNAs are produced. Introns are removed (spliced) and exons are joined together.
Segment of DNA that contains protein-coding information and various regulatory (e.g., promoter) and noncoding (e.g., introns) regions.
An enzyme that catalyzes the process of making RNA from a DNA template.
Segment of DNA that does not code for proteins.
Protein-coding segment of a gene.
An organelle in the cell found in the cytoplasm or endoplasmic reticulum. It is responsible for reading mRNA and protein assemblage.
A sequence that comprises three DNA nucleotides that together code for a protein.
RNA molecule involved in translation. Transfer RNA transports amino acids from the cell’s cytoplasm to a ribosome.
A classification given to phenotypic traits that are controlled by a single gene.
The physical appearance of a given trait.
The combination of two alleles that code for or are associated with the same gene.
A nonidentical DNA sequence found in the same gene location on a homologous chromosome, or gene copy, that codes for the same trait but produces a different phenotype.
Genotype that consists of two different alleles.
Genotype that consists of two identical alleles.
Refers to an allele for which one copy is sufficient to be visible in the phenotype.
Refers to an allele whose effect is not normally seen unless two copies are present in an individual’s genotype.
A protein that is found on a red blood cell’s surface.
Immune-related proteins that can detect and bind to foreign substances in the blood such as pathogens.
The effects of both alleles in a genotype can be seen in the phenotype.
A diagram of family relationships that indicates which members may have or carry certain genetic and/or phenotypic traits.
An individual who has a heterozygous genotype that is typically associated with a disease.
Refers to a pattern of inheritance in which an allele is located on an autosome (non sex chromosome).
Refers to a pattern of inheritance where the allele is located on the X or Y chromosome.
A genetic mutation (i.e., allele) that has a harmful phenotypic disease-causing effect.
Heterozygous genotype that produces a phenotype that is a blend of both alleles.
The proportion of how often the possession of an allele results in an expected phenotype. Some alleles are more penetrant than others.
A phenotype that is controlled by two or more genes.
A category of diseases that are polygenic and are also influenced by environment and lifestyle factors.
All the genetic information of an organism.
Changes in gene expression that do not result in a change of the underlying DNA sequence. These changes typically involve DNA methylation and histone modifications. These changes are reversible and can also be inherited by the next generation.
A molecular laboratory procedure that produces the order of nucleotide bases (i.e., sequences).
A molecular procedure that is performed to test for the presence of certain alleles or to discover new ones.
Methyl groups bind DNA, which modifies the transcriptional activity of a gene by turning it “on” or “off.”
he methylation pattern throughout a genome—that is, which genes (and other genomic sites) are methylated and unmethylated.
A molecular biology procedure that can make copies of genomic DNA segments. A small amount of DNA is used as a starting template and is then used to make millions of copies.
A process that involves the usage of fluorescently labeled nucleotides to visualize DNA (PCR fragments) at the nucleotide level.
A genotyping procedure that utilizes a microarray chip, which is a collection of thousands of short nucleotide sequences attached to a solid surface that can probe genomic DNA.
A genotyping technology that involves producing millions of nucleotide sequences (from a single DNA sample) that are then read with a sequencing machine. It can be used for analyzing entire genomes or specific regions and requires extensive program-based applications.
