Water and Climate Security
4.2 Water Security
Overview of Water Cycle
A unique aspect of life on Earth is that water exists in all three states – as a gas, as liquid and as a solid. Water in its liquid state is capable of absorbing massive amounts of energy. When light from the sun hits the Earth, the atmosphere (including atmospheric water) and oceans absorb this energy. Daily and annual energy fluctuations and exchanges between water reservoirs drive weather and climate.
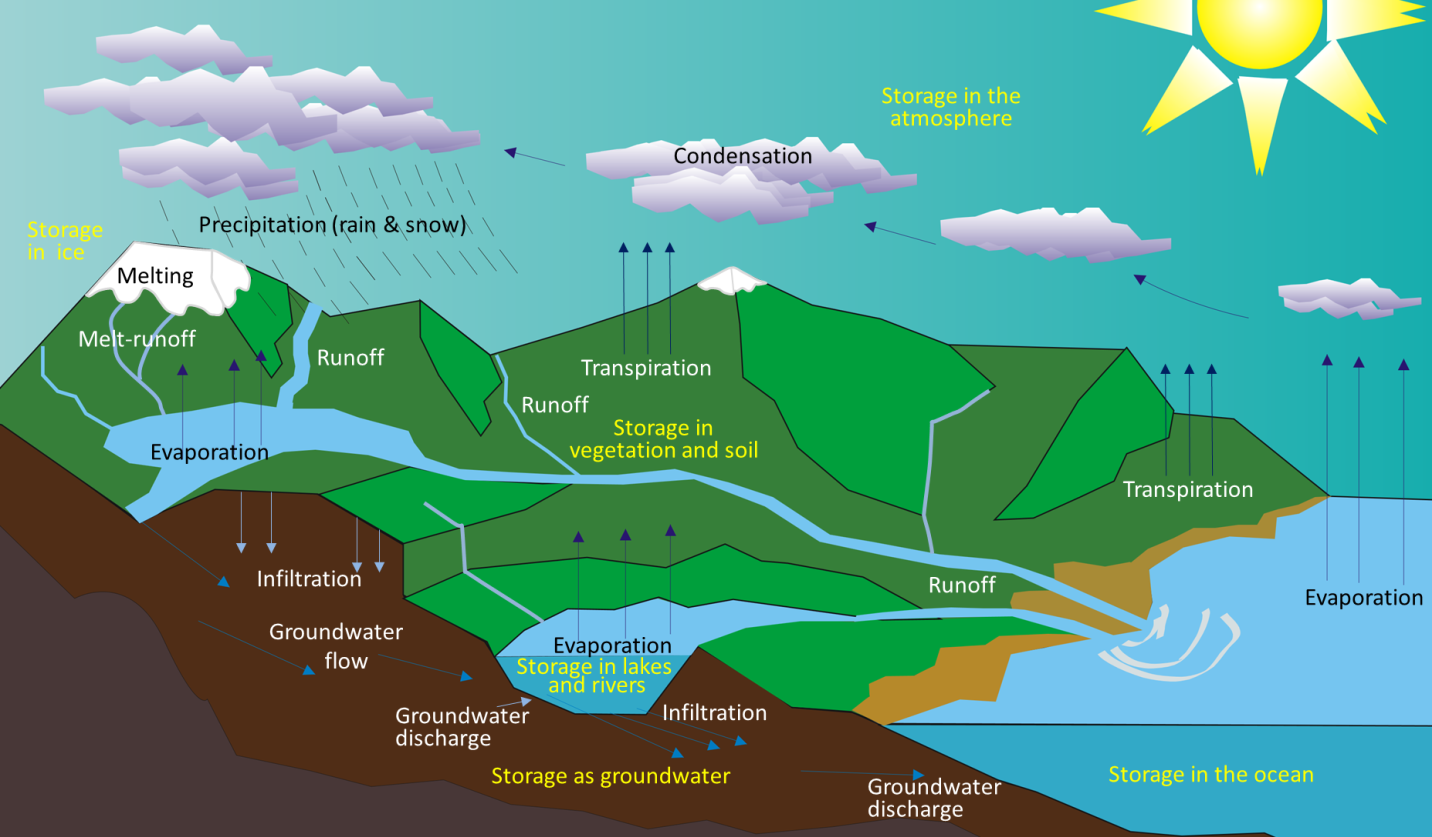
Water is constantly on the move. It is evaporated from the oceans, lakes, streams, the surface of the land, and plants (transpiration) by solar energy (Figure 13.2). It is moved through the atmosphere by winds and condenses to form clouds of water droplets or ice crystals. It comes back down as rain or snow and then flows through streams, into lakes, and eventually back to the oceans. Water on the surface and in streams and lakes infiltrates the ground to become groundwater. Groundwater slowly moves through the rock and surficial materials. Some groundwater returns to other streams and lakes, and some goes directly back to the oceans.
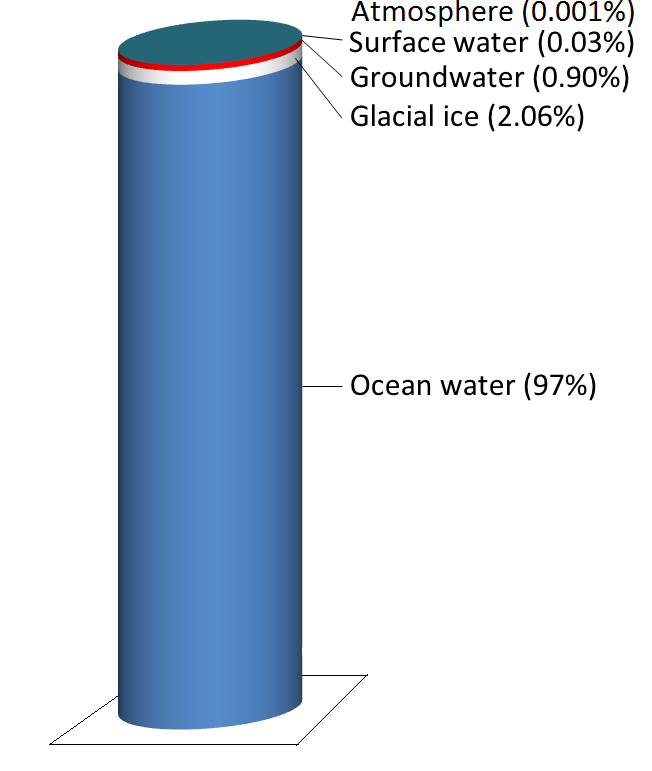
Even while it’s moving around, water is stored in various reservoirs. The largest, by far, is the oceans, accounting for 97% of the volume (Figure 4.1). Of course, that water is salty. The remaining 3% is fresh water. Two-thirds of our fresh water is stored in ice and one-third is stored in the ground. The remaining fresh water — about 0.03% of the total — is stored in lakes, streams, vegetation, and the atmosphere.
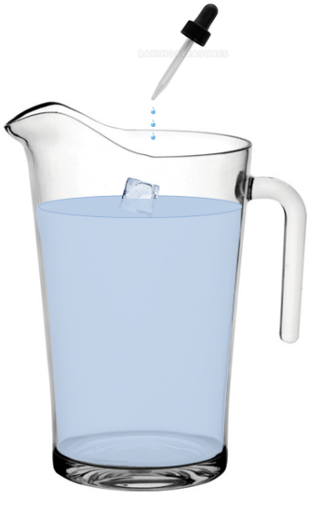
To put that in perspective, let’s think about putting all of Earth’s water into a 1 L jug (Figure 4.3). We start by almost filling the jug with 970 ml of water and 34 g of salt. Then we add one regular-sized (~20 mL) ice cube (representing glacial ice) and two teaspoons (~10 mL) of groundwater. All of the water that we see around us in lakes and streams and up in the sky can be represented by adding three more drops from an eyedropper.
Although the proportion of Earth’s water that is in the atmosphere is tiny, the actual volume is huge. At any given time, there is the equivalent of approximately 13,000 km3 of water in the air in the form of water vapour and water droplets in clouds. Water is evaporated from the oceans, vegetation, and lakes at a rate of 1,580 km3 per day, and just about exactly the same volume falls as rain and snow every day — over both the oceans and land. The precipitation that falls on land goes back to the ocean in the form of stream flow (117 km3/day) and groundwater flow (6 km3/day). Most of the rest of this chapter is about that 117 km3/day of streamflow. The average discharge of the Fraser River into the ocean is approximately 0.31 km3/day, or 0.26% of the world’s total.
