Food Access and Sustainability
2.2 Measuring Food Access
Measuring Food Access
In order to determine how to classify a neighborhood’s food environment, community food assets need to be measured. A food asset is a place where local residents can go to “grow, prepare, share, buy, receive or learn about food”[9]9 through, for example, community programs, retail outlets, urban gardens, and fresh food markets. Determining the number of food assets in a community can be challenging without a tangible way to collect the data. Toronto Public Health’s Food Strategy and the Toronto Food Policy Council created a way to measure the available food assets in the city, providing a tool to advocate for food environment change.
Toronto’s Food by Ward project was created as a way of measuring the unequal distribution of food assets across the city’s neighbourhoods.[10]10 This information was collected through grassroots organizing in each city ward. In each area, Food Champions led the data collection through several rounds of community consultations. Food Champions are “people who care about food, healthy communities, and economic development, and (who) are working together to protect, promote, and strengthen food assets.”[11]11
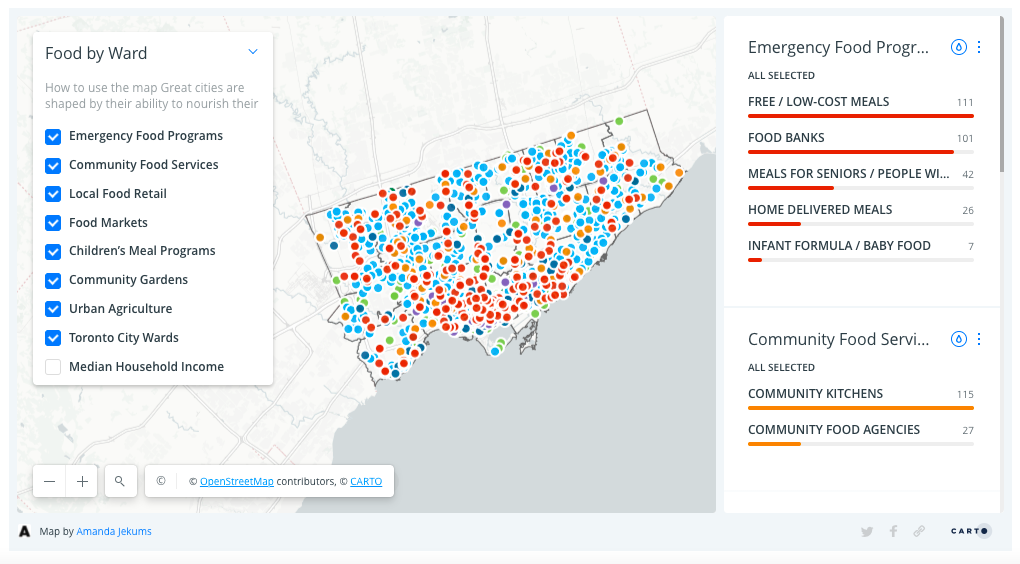
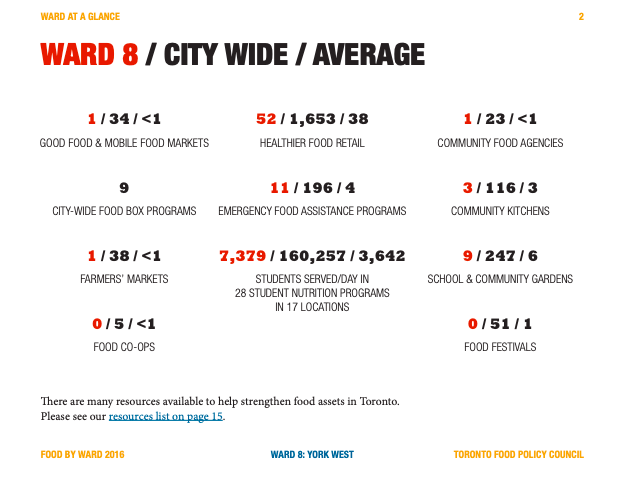
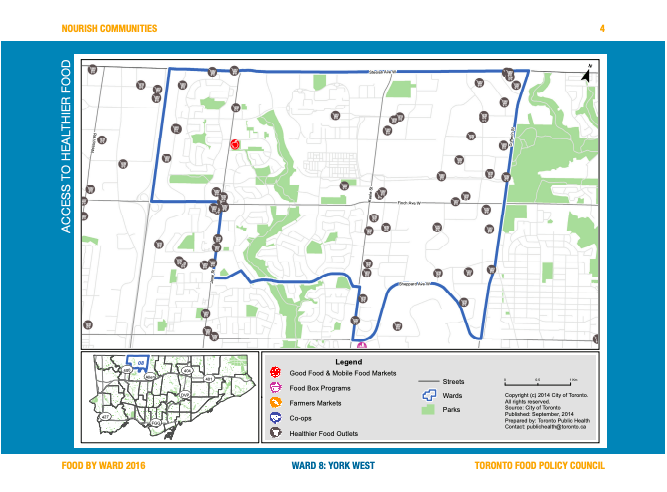
The food asset categories that were collected within the Food by Ward project included: emergency food programs, community food services, local food retail outlets, food markets, children’s meal programs, community gardens, and urban agriculture projects.[12]12 The data was collected and mapped, so residents and policy makers could visualize the assets, as well as determine which communities were lacking or had an abundance of food. This provided community organizers with the data needed to approach City Council representatives in their specific wards and advocate for change. This project makes the case that food-related projects and development are just as important as other urban infrastructure.[13]13
Food by Ward is an excellent example of measuring food access, but is highly dependent on resources to maintain the data. Without dedicated funding, the tool is not sustainable. While the tool itself is not currently being maintained across all of metropolitan Toronto, some individual neighbourhoods, like Rexdale, have taken on their own asset mapping on a smaller scale. This allows each neighbourhood to ensure that their maps are updated and reflect their current situation. Food asset mapping has a lot of potential for measuring access to food, but there needs to be a sustainable approach, including the human and technical resources needed to maintain the data.
Food Mapping in the United States
The following link provides interactive maps, data visualizations, and narrative text to illustrate the geographical distribution of food deserts across the United States. It offers a detailed look into the systemic and socioeconomic factors that contribute to limited access to healthy, affordable food, such as a lack of nearby grocery stores, low income, and transportation barriers. This tool can help you to understand the scale of food insecurity as a spatial problem and identify specific communities that may be most in need of food justice initiatives.
Review the following link: Food Access Research Project
